


NETVIBES solutions on the 3DEXPERIENCE Platform help customers reveal information intelligence. Today’s fast-paced, the connected world generates exponential amounts of data inside and outside the enterprise, 24/7. With NETVIBES you can make sense of it all by gaining actionable insights to make informed decisions. An increase in industry innovation, boost operational excellence, and improve business performance to stay ahead of the competition.
Leading companies worldwide rely on NETVIBES data discovery solutions to search, reveal, and manage their information assets for faster, real-time unified data access, smarter decision-making, and improved productivity.
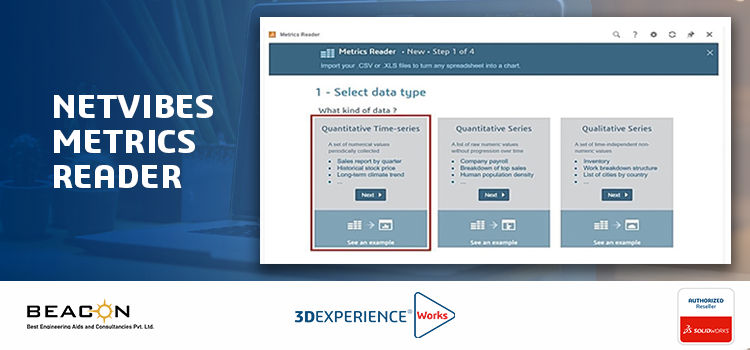
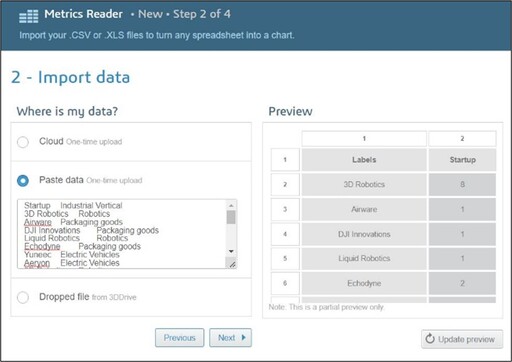
Netvibes Metrics Reader allows you to create a chart based on a dataset of yours that you must import during the configuration of the widget.
Metrics Reader is a public cloud dashboard app that offers the following key capabilities:
Metrics Reader can be used in conjunction with 3DDrive, Social Analytics, and Potion.
When you add a Metrics Reader widget to your dashboard, you must configure it with your own data set so it can display a chart.
You can edit the configuration of any Metrics Reader widget you have configured yourself.
You can Import your own data (.CSV or .XLS) to analyze trends and discover insights using customizable charts and graphs.
The task shows you how to:
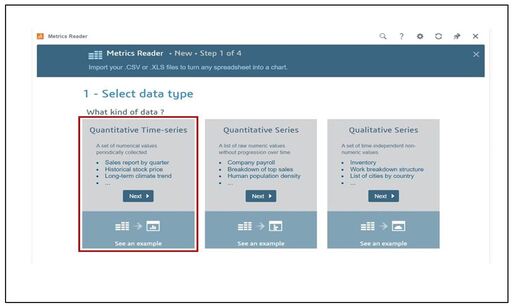
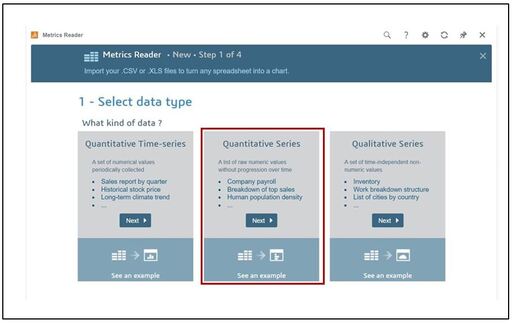
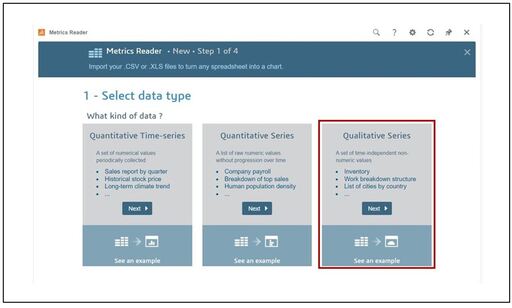
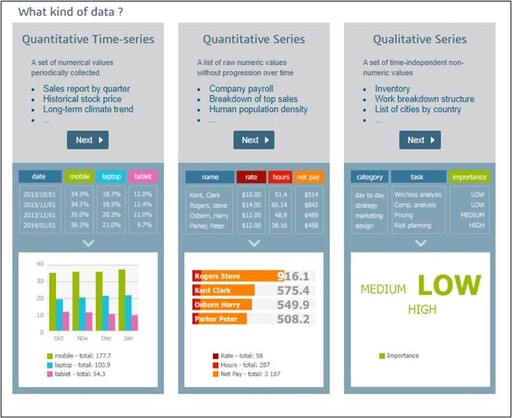
1. Select data type
Quantitative Time-Series
To import a set of numerical values collected over a regular interval of time. We will be looking in
detail at the Quantitative time-series
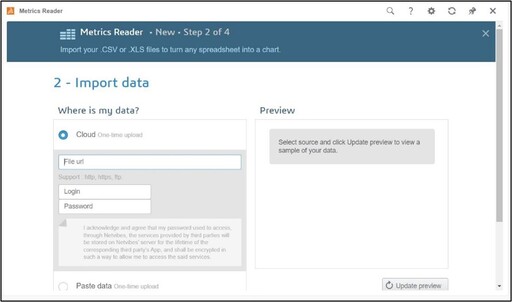
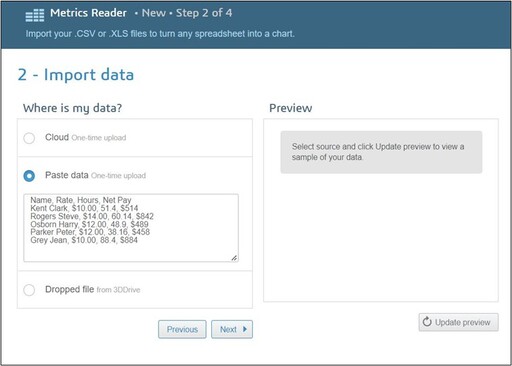
2. Import Data
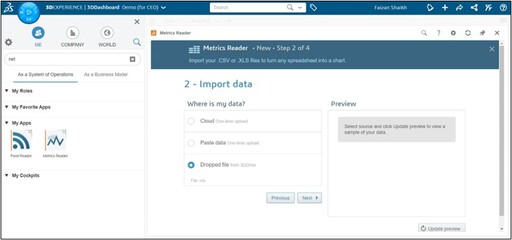
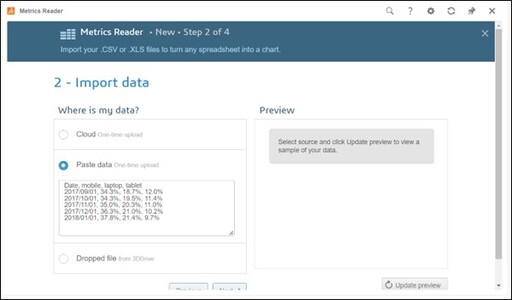
There are three options for importing the data
i. Cloud (One time upload)
It would be one time-upload where you can fill the File URL with Login ID and Password
Select Cloud and enter the URL of a file hosted on the cloud. If access is protected, enter your credentials.
Note: Your 3DEXPERIENCE Platform must have access to the internet if the URL you entered points to a resource that is located on the internet.
ii. Paste Data
Select Paste data and paste the data you have copied into your clipboard.
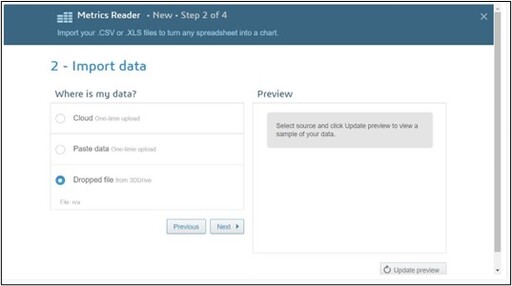
iii. Dropped file
Select the Dropped file and drag a file from your 3DDrive (3DDrive is the storage application that sits on the 3DEXPERIENCE Platform. As a basic comparison, it is similar to Dropbox, Google Drive, OneDrive, and in fact, these three programs can also be integrated into 3DEXPERIENCE.)
Also, it has an advantage if you open that dropped file from 3DDrive and edit it the Charts will update automatically.
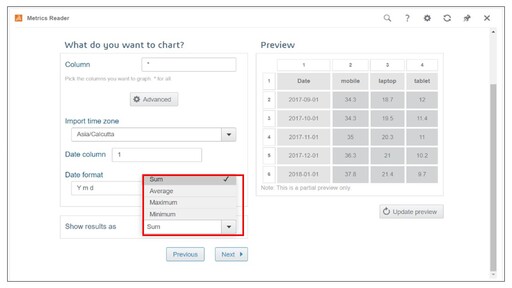
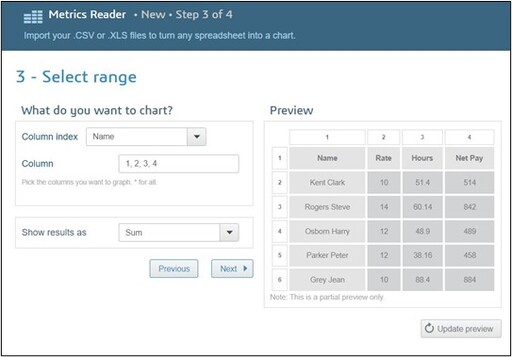
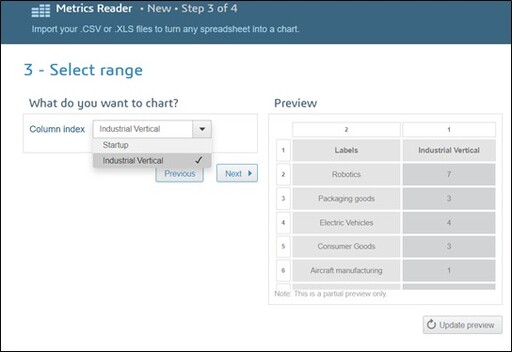
3. Select Range
Here you can select a column and import the time zone, specifying the date column and finally date format. On the other hand, you can show results as Sum, Average, Maximum, and Minimum.
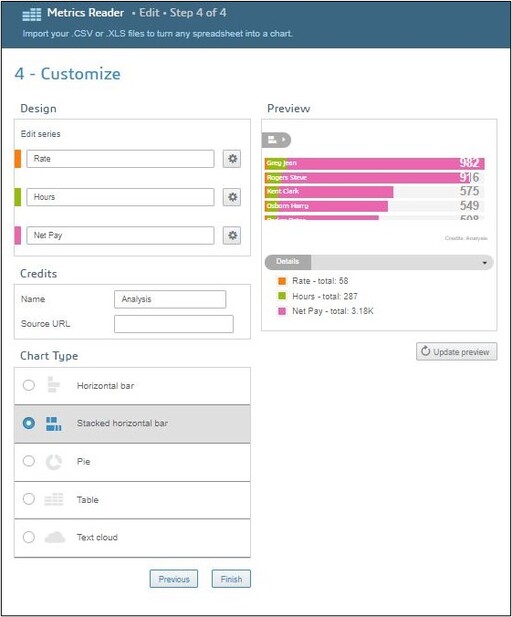
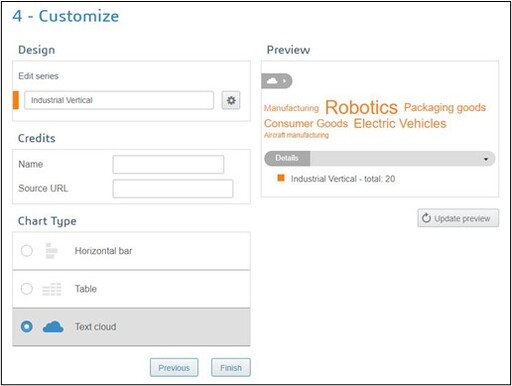
4. Customize
In the design tab, you can edit the series of your products with Forecast, Smoothed curve, Linear regression, total, and time zone. Also, you can specify the name and Source URL in the Credits tab then Select the Chart type as shown in the image.
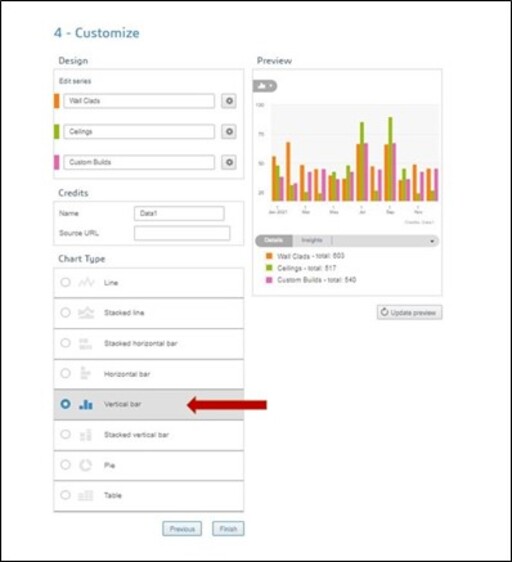
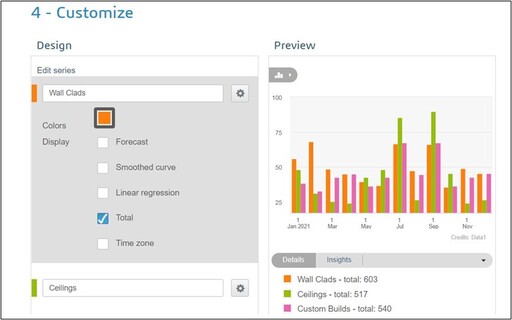
It is a personalized dashboard helping millions daily to monitor, personalize and publish all aspects of their daily digital lives. You can have different Chart types based on the requirement of your company and set many Metrix readers on the required tab in the dashboard that would cover all the necessary data of your company under one page.
Quantitative Series
To import a set of non-numerical values that are associated with a numerical value.
Click on Next > Select any of the types depending upon your requirement.
Click on Next > Select Column Index from the drop-down list > Similarly Show results as Sum/Average/Maximum/Minimum.
Click Next > From the Customize tab > Edit series > Type the name or Source URL in the credit’s tabs
Select the Chart type > Finish.
Qualitative Series
To import a set of non-numerical values.
Click on next > Import data > Select any one of the import option > Next
Under Select range tab > Select column range from the drop-down list then click on next.
After adding the details in Design, Credits, and Chart type click on finish.
You can select any type of data and create charts based on your requirements. Below is the Difference between the type of data.
Basically, it would help you in replacing the traditional method of analyzing the excel files of your data which leads to errors, and which is very time-consuming. Also, it is easily accessible from anywhere, anytime and on any device just you need to log in to the platform and access it.
We Urge You To Call Us For Any Doubts & Clarifications That You May Have. We Are Eager to Talk To You
Call Us: +91 7406663589
 (No Ratings Yet)
#365/8, Ground Floor, "Hasmitha Avenue", 16th Main, 4th T Block East, Jayanagar, 4th T Block East, Pattabhirama Nagar, Jayanagar, Bengaluru, Karnataka 560041
Rated 4.7/5 with a total of 62 reviews
"CARAX" Building 4th Floor, 105/1/1/4, Next to Radha Hotel, Pune-Mumbai Xpress Way,Baner,Pune 411045
Rated 4.7/5 with a total of 17 reviews
1002, LODHA Supremus, I-Think Techno Campus,Kanjurmarg EAST - MUMBAI, MH, India – 400042.
Rated 5/5 with a total of 51 reviews
508, Shiti Ratna Complex, Panchwati Cross Road, Ahmedabad-380006
Rated 4.1/5 with a total of 7 reviews
Kanda's Villa, II Floor, AE Block,3362 R, 8th Street, Anna Nagar, Chennai, Tamil Nadu 600040
Rated 4.6/5 with a total of 16 reviews
Flat no F1, first floor, Nakhate corner, Eknath rang mandir road,New Usmanpura, Aurangabad, 431005.
A-101, 1st Floor, The Hub Complex, opp. Shete Hospital, Mahatma Nagar, Parijat Nagar, Nashik, Maharashtra 422005.
Level 7, Octave 3B Salarpuria Sattva Knowledge City, Inorbit Mall Road, Raidurg Village, Hi-tech City, Hyderabad, Telangana - 500081, India

pin up https://azerbaijancuisine.com/# pin up 306
pin up azerbaycan
medicine in mexico pharmacies [url=https://northern-doctors.org/#]mexican pharmacy[/url] reputable mexican pharmacies online
mexico drug stores pharmacies [url=https://northern-doctors.org/#]mexican pharmacy northern doctors[/url] mexican mail order pharmacies
pharmacies in mexico that ship to usa [url=https://northern-doctors.org/#]Mexico pharmacy that ship to usa[/url] mexican online pharmacies prescription drugs
mexican border pharmacies shipping to usa: mexican pharmacy online – п»їbest mexican online pharmacies
medicine in mexico pharmacies: best online pharmacies in mexico – mexican border pharmacies shipping to usa
mexican mail order pharmacies: northern doctors pharmacy – buying from online mexican pharmacy
mexican drugstore online: mexico drug stores pharmacies – mexico drug stores pharmacies
best online pharmacies in mexico: Mexico pharmacy that ship to usa – mexican online pharmacies prescription drugs
mexican rx online: mexican pharmacy online – mexican pharmacy
purple pharmacy mexico price list: mexican pharmacy – buying from online mexican pharmacy
https://northern-doctors.org/# best online pharmacies in mexico
reputable mexican pharmacies online: mexican pharmacy online – mexico pharmacies prescription drugs
reputable mexican pharmacies online: mexican northern doctors – mexican rx online
http://northern-doctors.org/# buying prescription drugs in mexico
mexican mail order pharmacies: northern doctors pharmacy – mexican mail order pharmacies
http://northern-doctors.org/# buying prescription drugs in mexico online
medicine in mexico pharmacies: northern doctors – buying prescription drugs in mexico
mexican mail order pharmacies [url=http://northern-doctors.org/#]mexican northern doctors[/url] reputable mexican pharmacies online
mexican online pharmacies prescription drugs: buying prescription drugs in mexico – mexico drug stores pharmacies
https://northern-doctors.org/# best online pharmacies in mexico
reputable mexican pharmacies online: mexican pharmacy northern doctors – mexico pharmacies prescription drugs
https://northern-doctors.org/# mexican rx online
mexican online pharmacies prescription drugs: northern doctors – mexican mail order pharmacies
reputable mexican pharmacies online: northern doctors pharmacy – buying prescription drugs in mexico online
https://northern-doctors.org/# mexican pharmaceuticals online
pharmacies in mexico that ship to usa: mexican northern doctors – mexican online pharmacies prescription drugs
mexico drug stores pharmacies [url=https://northern-doctors.org/#]buying prescription drugs in mexico[/url] buying prescription drugs in mexico
mexico pharmacy: mexican online pharmacies prescription drugs – purple pharmacy mexico price list
pharmacies in mexico that ship to usa [url=https://cmqpharma.online/#]online mexican pharmacy[/url] medication from mexico pharmacy
mexico drug stores pharmacies [url=http://cmqpharma.com/#]online mexican pharmacy[/url] mexican rx online
mexico drug stores pharmacies [url=https://cmqpharma.com/#]mexican pharmacy[/url] mexico drug stores pharmacies
mexico pharmacy [url=http://cmqpharma.com/#]mexican pharmacy[/url] mexican pharmacy
mexican mail order pharmacies [url=http://cmqpharma.com/#]mexico pharmacy[/url] medicine in mexico pharmacies
mexico drug stores pharmacies
https://cmqpharma.com/# mexico drug stores pharmacies
mexican online pharmacies prescription drugs
buying prescription drugs in mexico online [url=https://cmqpharma.online/#]cmq pharma[/url] mexico drug stores pharmacies
best online pharmacies in mexico [url=https://cmqpharma.online/#]mexican pharmacy[/url] mexican mail order pharmacies
http://indiapharmast.com/# india pharmacy mail order
pharmacy website india [url=https://indiapharmast.com/#]india pharmacy mail order[/url] indian pharmacy paypal
canadian mail order pharmacy [url=http://canadapharmast.com/#]canadian pharmacy oxycodone[/url] thecanadianpharmacy
https://canadapharmast.com/# canadian drug pharmacy
Wow, this was a really quality post In theory I’d like to write like this too – taking time and actual effort to make a good post… but what can I say… I procrastinate alot and never appear to get something done
buying prescription drugs in mexico [url=http://foruspharma.com/#]buying prescription drugs in mexico online[/url] buying prescription drugs in mexico
http://foruspharma.com/# п»їbest mexican online pharmacies
mexican rx online [url=https://foruspharma.com/#]pharmacies in mexico that ship to usa[/url] pharmacies in mexico that ship to usa
https://indiapharmast.com/# buy medicines online in india
cost clomid tablets: can you buy generic clomid without a prescription – can i purchase cheap clomid no prescription
buy cheap clomid price: where can i get cheap clomid pills – can i buy cheap clomid for sale
purchase cipro: buy generic ciprofloxacin – antibiotics cipro
paxlovid cost without insurance: Paxlovid over the counter – paxlovid price
where can i get doxycycline online: doxycycline 10mg tablets – order doxycycline 100mg without prescription
paxlovid india: Paxlovid over the counter – Paxlovid over the counter
п»їcipro generic: п»їcipro generic – buy cipro online canada
paxlovid covid: п»їpaxlovid – paxlovid cost without insurance
paxlovid for sale: paxlovid cost without insurance – п»їpaxlovid
can i buy doxycycline over the counter uk: doxycycline 50mg tablets price – buy doxycycline online nz
mexican online pharmacies prescription drugs: mexico drug stores pharmacies – mexican drugstore online
medicine in mexico pharmacies: mexico pharmacies prescription drugs – reputable mexican pharmacies online
buying prescription drugs in mexico online [url=https://mexicandeliverypharma.online/#]pharmacies in mexico that ship to usa[/url] mexican pharmaceuticals online
mexico drug stores pharmacies: п»їbest mexican online pharmacies – medication from mexico pharmacy
reputable mexican pharmacies online: mexican pharmaceuticals online – п»їbest mexican online pharmacies
https://mexicandeliverypharma.com/# п»їbest mexican online pharmacies
reputable mexican pharmacies online [url=http://mexicandeliverypharma.com/#]mexican pharmaceuticals online[/url] п»їbest mexican online pharmacies
mexican mail order pharmacies: medication from mexico pharmacy – mexico drug stores pharmacies
mexican online pharmacies prescription drugs: mexican drugstore online – mexican rx online
https://mexicandeliverypharma.online/# purple pharmacy mexico price list
mexico pharmacies prescription drugs [url=https://mexicandeliverypharma.com/#]mexico drug stores pharmacies[/url] п»їbest mexican online pharmacies
medication from mexico pharmacy: best online pharmacies in mexico – mexican border pharmacies shipping to usa
mexico pharmacies prescription drugs: mexican mail order pharmacies – buying prescription drugs in mexico
buying prescription drugs in mexico online: mexico pharmacies prescription drugs – mexico pharmacies prescription drugs
medicine in mexico pharmacies [url=https://mexicandeliverypharma.com/#]medication from mexico pharmacy[/url] best online pharmacies in mexico
medication from mexico pharmacy: buying prescription drugs in mexico online – buying prescription drugs in mexico online
http://mexicandeliverypharma.com/# mexico drug stores pharmacies
mexican rx online: mexico pharmacies prescription drugs – buying prescription drugs in mexico online
mexico pharmacies prescription drugs: pharmacies in mexico that ship to usa – mexican online pharmacies prescription drugs
pharmacies in mexico that ship to usa [url=http://mexicandeliverypharma.com/#]mexican mail order pharmacies[/url] purple pharmacy mexico price list
п»їbest mexican online pharmacies: mexican rx online – reputable mexican pharmacies online
purple pharmacy mexico price list: reputable mexican pharmacies online – п»їbest mexican online pharmacies
best online pharmacies in mexico: mexico pharmacies prescription drugs – mexico drug stores pharmacies
mexican online pharmacies prescription drugs [url=https://mexicandeliverypharma.com/#]medicine in mexico pharmacies[/url] pharmacies in mexico that ship to usa
purple pharmacy mexico price list: medication from mexico pharmacy – mexico drug stores pharmacies
buying from online mexican pharmacy: п»їbest mexican online pharmacies – buying from online mexican pharmacy
mexico pharmacies prescription drugs: buying from online mexican pharmacy – mexico pharmacies prescription drugs
mexican pharmacy [url=http://mexicandeliverypharma.com/#]medication from mexico pharmacy[/url] mexican pharmaceuticals online
best online pharmacies in mexico: best online pharmacies in mexico – mexican online pharmacies prescription drugs
mexican drugstore online: mexican drugstore online – mexico pharmacies prescription drugs
buying prescription drugs in mexico online [url=https://mexicandeliverypharma.com/#]best online pharmacies in mexico[/url] purple pharmacy mexico price list
buying from online mexican pharmacy: reputable mexican pharmacies online – pharmacies in mexico that ship to usa
buying prescription drugs in mexico online: buying prescription drugs in mexico – mexican pharmaceuticals online
medicine in mexico pharmacies: medication from mexico pharmacy – medicine in mexico pharmacies
pharmacies in mexico that ship to usa [url=https://mexicandeliverypharma.com/#]mexico drug stores pharmacies[/url] medication from mexico pharmacy
mexican online pharmacies prescription drugs: mexican drugstore online – best online pharmacies in mexico
buying from online mexican pharmacy: mexican rx online – buying from online mexican pharmacy
medicine in mexico pharmacies: medicine in mexico pharmacies – buying prescription drugs in mexico online
mexico pharmacies prescription drugs [url=https://mexicandeliverypharma.online/#]mexican border pharmacies shipping to usa[/url] mexican drugstore online
medication from mexico pharmacy: mexican rx online – best online pharmacies in mexico
mexico pharmacies prescription drugs: mexico pharmacies prescription drugs – buying from online mexican pharmacy
buying prescription drugs in mexico: best online pharmacies in mexico – mexican border pharmacies shipping to usa
medication from mexico pharmacy [url=http://mexicandeliverypharma.com/#]purple pharmacy mexico price list[/url] best online pharmacies in mexico
medication from mexico pharmacy: mexican rx online – mexican border pharmacies shipping to usa
mexico pharmacies prescription drugs: mexican mail order pharmacies – mexican border pharmacies shipping to usa
reputable mexican pharmacies online: mexico drug stores pharmacies – mexican drugstore online
mexico drug stores pharmacies [url=https://mexicandeliverypharma.com/#]reputable mexican pharmacies online[/url] mexico drug stores pharmacies
buying prescription drugs in mexico: mexico drug stores pharmacies – pharmacies in mexico that ship to usa
medicine in mexico pharmacies: mexican border pharmacies shipping to usa – mexico pharmacies prescription drugs
mexico pharmacies prescription drugs: best online pharmacies in mexico – best online pharmacies in mexico
reputable mexican pharmacies online [url=http://mexicandeliverypharma.com/#]mexican pharmaceuticals online[/url] mexican mail order pharmacies
mexican drugstore online: mexican pharmaceuticals online – medication from mexico pharmacy
medication from mexico pharmacy: mexican pharmaceuticals online – reputable mexican pharmacies online
mexican rx online: mexico drug stores pharmacies – medicine in mexico pharmacies
buying prescription drugs in mexico [url=https://mexicandeliverypharma.online/#]mexican pharmaceuticals online[/url] mexico pharmacies prescription drugs
best online pharmacies in mexico: mexican mail order pharmacies – mexican border pharmacies shipping to usa
mexican pharmaceuticals online: mexican drugstore online – mexican online pharmacies prescription drugs
mexican rx online: п»їbest mexican online pharmacies – medicine in mexico pharmacies
reputable mexican pharmacies online [url=http://mexicandeliverypharma.com/#]reputable mexican pharmacies online[/url] buying prescription drugs in mexico online
mexico pharmacies prescription drugs: buying prescription drugs in mexico online – п»їbest mexican online pharmacies
mexico pharmacies prescription drugs: mexico drug stores pharmacies – purple pharmacy mexico price list
mexican mail order pharmacies: buying from online mexican pharmacy – buying from online mexican pharmacy
mexican rx online [url=https://mexicandeliverypharma.online/#]purple pharmacy mexico price list[/url] pharmacies in mexico that ship to usa
mexican rx online: medicine in mexico pharmacies – mexican drugstore online
mexican pharmaceuticals online: mexican pharmaceuticals online – mexican online pharmacies prescription drugs
mexico pharmacies prescription drugs: best online pharmacies in mexico – best online pharmacies in mexico
pharmacies in mexico that ship to usa [url=http://mexicandeliverypharma.com/#]п»їbest mexican online pharmacies[/url] mexican pharmaceuticals online
purple pharmacy mexico price list: mexican pharmaceuticals online – best online pharmacies in mexico
buying from online mexican pharmacy: purple pharmacy mexico price list – mexican border pharmacies shipping to usa
mexican drugstore online: medication from mexico pharmacy – mexican drugstore online
best online pharmacies in mexico [url=https://mexicandeliverypharma.com/#]mexico pharmacies prescription drugs[/url] mexican mail order pharmacies
mexico drug stores pharmacies: mexico pharmacies prescription drugs – mexican rx online
medication from mexico pharmacy: buying prescription drugs in mexico – buying from online mexican pharmacy
cost of propecia without rx: order propecia no prescription – rx propecia
http://propeciabestprice.pro/# cost of cheap propecia without insurance
zithromax 250 mg [url=http://zithromaxbestprice.pro/#]buy generic zithromax online[/url] where can i buy zithromax uk
https://zithromaxbestprice.pro/# zithromax for sale cheap
generic prednisone 10mg [url=http://prednisonebestprice.pro/#]prednisone cream rx[/url] buy prednisone without prescription paypal
prednisone without prescription.net: prednisone 10 tablet – where to buy prednisone in australia
https://nolvadexbestprice.pro/# nolvadex gynecomastia
http://propeciabestprice.pro/# cost of propecia without prescription
prednisone 20 mg purchase [url=http://prednisonebestprice.pro/#]purchase prednisone[/url] prednisone pill 20 mg
zithromax antibiotic: zithromax cost – zithromax 1000 mg pills
https://cytotecbestprice.pro/# purchase cytotec
zithromax drug: buy zithromax canada – can you buy zithromax over the counter in canada
tamoxifen skin changes: tamoxifen and antidepressants – tamoxifen side effects forum
http://propeciabestprice.pro/# generic propecia without rx
tamoxifen men: nolvadex pct – does tamoxifen cause joint pain
tamoxifen brand name: tamoxifen and osteoporosis – tamoxifen and ovarian cancer
Abortion pills online: buy cytotec online fast delivery – Misoprostol 200 mg buy online
http://zithromaxbestprice.pro/# zithromax 250 mg
otc prednisone cream: prednisone 2.5 tablet – cost of prednisone 40 mg
Hair Getting regular trims is essential Using a smoothing serum that works for your hair can do wonders to make your hair shiny and lovely inside a flash Combined with a ceramic flat iron, your hair will look shiny and silky smooth in minutes, even if you didn’t eat correct or get enough rest
buy generic prednisone online: prednisone 20mg online – prednisone 20 mg tablets
https://nolvadexbestprice.pro/# pct nolvadex
Thanks for sharing. I read many of your blog posts, cool, your blog is very good.
tamoxifen postmenopausal: tamoxifen and weight loss – tamoxifen joint pain
farmacie online autorizzate elenco: Cialis generico 5 mg prezzo – Farmacie online sicure
comprare farmaci online con ricetta: Cialis generico 20 mg 8 compresse prezzo – comprare farmaci online con ricetta
http://kamagrait.pro/# farmacia online
viagra pfizer 25mg prezzo: viagra senza ricetta – gel per erezione in farmacia
viagra consegna in 24 ore pagamento alla consegna: viagra prezzo – farmacia senza ricetta recensioni
farmacia online: Farmacie on line spedizione gratuita – farmacie online autorizzate elenco
farmacie online affidabili: Cialis generico farmacia – farmacia online senza ricetta
Farmacia online piГ№ conveniente: Cialis generico 5 mg prezzo – Farmacia online miglior prezzo
https://cialisgenerico.life/# farmacie online autorizzate elenco
viagra cosa serve: viagra prezzo – gel per erezione in farmacia
farmacia online senza ricetta: Tadalafil generico migliore – п»їFarmacia online migliore
migliori farmacie online 2024: kamagra gel – farmacie online autorizzate elenco
comprare farmaci online con ricetta: Farmacie online sicure – farmacie online affidabili
https://avanafil.pro/# farmacia online
viagra originale recensioni: viagra generico – miglior sito per comprare viagra online
farmacie online autorizzate elenco: Cialis generico farmacia – acquisto farmaci con ricetta
buy cialis with paypal payment: Generic Tadalafil 20mg price – cialis 20 mg tablets
http://tadalafil.auction/# how can i cialis without custom delayed in canada
http://tadalafil.auction/# cialis without a doctor prescription reddit
where to get the best price on cialis [url=https://tadalafil.auction/#]cheapest tadalafil[/url] canadian pharmacy no prescription cialis
can you buy cialis without a prescription: Generic Tadalafil 20mg price – buy generic cialis in canada
http://tadalafil.auction/# curved penis and cialis
generic cialis 20mg x 15 tabs: Buy Tadalafil 20mg – low cost cialis
cost of viagra: Cheap generic Viagra – viagra samples
https://tadalafil.auction/# best place to buy cialis online forum
viagra coupon [url=http://sildenafil.llc/#]buy sildenafil online canada[/url] buy viagra generic
http://tadalafil.auction/# cialis paypal pay with
https://indiapharmacy.shop/# pharmacy website india
erectile dysfunction medicine online
top 10 pharmacies in india: top online pharmacy india – top 10 pharmacies in india
https://edpillpharmacy.store/# how to get ed pills
http://indiapharmacy.shop/# pharmacy website india
erectile dysfunction medicine online
buy ed pills: Best ED pills non prescription – cheap ed meds
https://mexicopharmacy.win/# mexican pharmaceuticals online
online ed treatments
https://mexicopharmacy.win/# mexico drug stores pharmacies
mexican drugstore online: Purple pharmacy online ordering – mexican mail order pharmacies
http://mexicopharmacy.win/# medicine in mexico pharmacies
cheapest ed medication
top 10 online pharmacy in india: Online India pharmacy – indian pharmacy
https://mexicopharmacy.win/# mexico drug stores pharmacies
top online pharmacy india: Cheapest online pharmacy – top online pharmacy india
https://edpillpharmacy.store/# affordable ed medication
buy prescription drugs from india: best india pharmacy – india online pharmacy
п»їlegitimate online pharmacies india: Online India pharmacy – indian pharmacy
http://indiapharmacy.shop/# indianpharmacy com
indianpharmacy com: Indian pharmacy online – indian pharmacy
medicine in mexico pharmacies: Purple pharmacy online ordering – reputable mexican pharmacies online
http://mexicopharmacy.win/# mexican rx online
indian pharmacy: Cheapest online pharmacy – pharmacy website india
https://indiapharmacy.shop/# pharmacy website india
pharmacies in mexico that ship to usa: mexican pharmacy – buying prescription drugs in mexico online
buying from online mexican pharmacy: Certified Mexican pharmacy – medicine in mexico pharmacies
http://edpillpharmacy.store/# online ed drugs
best online pharmacies in mexico: mexico pharmacy win – п»їbest mexican online pharmacies
http://mexicopharmacy.win/# medicine in mexico pharmacies
india online pharmacy: indian pharmacy – buy prescription drugs from india
best online pharmacies in mexico: Best pharmacy in Mexico – buying from online mexican pharmacy
erection pills online: Best ED meds online – cheap ed meds
mexican drugstore online: Medicines Mexico – mexican mail order pharmacies
Your article helped me a lot, is there any more related content? Thanks!
mexico pharmacies prescription drugs: Medicines Mexico – medicine in mexico pharmacies
Заказать такси https://taxi-gukovo.ru эконом в Гуково дешево с отзывами, ценами и телефонами, онлайн заказ.
mexican mail order pharmacies: Purple pharmacy online ordering – mexico drug stores pharmacies
lipitor generic price: cheapest ace inhibitor – cheap lipitor 20 mg
lasix dosage [url=https://furosemide.win/#]furosemide online[/url] buy furosemide online
https://cytotec.pro/# buy cytotec in usa
Abortion pills online https://lisinopril.guru/# lisinopril 20 mg tablet price
lasix tablet
furosemide 40 mg: furosemide online – lasix for sale
lasix dosage [url=https://furosemide.win/#]cheap lasix[/url] lasix generic
buy cytotec online fast delivery https://tamoxifen.bid/# pct nolvadex
lasix
https://tamoxifen.bid/# tamoxifen menopause
cost of lipitor: buy lipitor 20mg – lipitor 5 mg tablet
Abortion pills online http://cytotec.pro/# buy cytotec online fast delivery
furosemide 40mg
tamoxifen endometriosis [url=https://tamoxifen.bid/#]Purchase Nolvadex Online[/url] tamoxifen
продвижение сайта yandex https://process-seo.ru
https://lisinopril.guru/# zestril price in india
Abortion pills online https://tamoxifen.bid/# tamoxifen
lasix online
cytotec abortion pill: buy cytotec pills online cheap – buy cytotec
https://furosemide.win/# lasix 100 mg tablet
40 mg lisinopril for sale: Lisinopril online prescription – lisinopril 250mg
lipitor generic brand [url=http://lipitor.guru/#]buy atorvastatin online[/url] generic lipitor 10mg
buy misoprostol over the counter http://tamoxifen.bid/# tamoxifen bone pain
lasix uses
buy lipitor: Lipitor 10 mg price – lipitor generic drug
http://tamoxifen.bid/# how to lose weight on tamoxifen
lisinopril 3973: lisinopril online uk – lisinopril 18 mg
п»їcytotec pills online http://lisinopril.guru/# zestril 10
buy furosemide online
https://tamoxifen.bid/# tamoxifen estrogen
buy nolvadex online: buy tamoxifen citrate – tamoxifen warning
alternative to tamoxifen: buy tamoxifen citrate – where to buy nolvadex
buy cytotec https://cytotec.pro/# buy cytotec online
furosemida
lisinopril 240: Lisinopril online prescription – lisinopril 5 mg price
п»їcytotec pills online: cytotec best price – buy cytotec in usa
purchase cytotec https://lipitor.guru/# lipitor 10mg price comparison
buy lasix online
lasix generic name: cheap lasix – lasix 40mg
cytotec pills buy online https://lisinopril.guru/# lisinopril 40 mg tablet
furosemide 100 mg
Как не ошибиться при покупке генератора Generac, советы по выбору генератора Generac.
В чем отличие генератора Generac от других моделей?, подробный обзор генератора Generac.
Генератор Generac для надежного источника энергии, подробный обзор.
Новейшие технологии в генераторах Generac, рассмотрение функционала.
Преимущества использования генератора Generac, подробный анализ.
Эффективное решение для энергетической безопасности: генераторы Generac, советы эксперта.
Надежный источник электропитания: генераторы Generac, рассмотрение преимуществ.
Секреты правильного выбора генератора Generac, анализ функционала.
Безопасность и надежность: генераторы Generac, советы по установке.
Как выбрать генератор Generac для вашего дома?, подбор модели.
генератор дженерак [url=https://generac-generatory1.ru/]https://generac-generatory1.ru/[/url] .
buy misoprostol over the counter: buy cytotec online – purchase cytotec
cytotec abortion pill http://tamoxifen.bid/# nolvadex d
buy furosemide online
lisinopril 40 coupon: cheap lisinopril – order lisinopril online
https://easyrxindia.shop/# online pharmacy india
online pharmacy india: buy medicines online in india – Online medicine order
https://easyrxcanada.online/# canadian pharmacy uk delivery
mexican rx online [url=https://mexstarpharma.online/#]mexican mail order pharmacies[/url] mexico drug stores pharmacies
http://mexstarpharma.com/# mexico drug stores pharmacies
mexican pharmacy: mexican pharmaceuticals online – buying from online mexican pharmacy
mexican mail order pharmacies [url=https://mexstarpharma.online/#]п»їbest mexican online pharmacies[/url] buying from online mexican pharmacy
http://easyrxindia.com/# top 10 pharmacies in india
http://easyrxcanada.com/# canadian pharmacy com
reputable mexican pharmacies online: п»їbest mexican online pharmacies – mexican drugstore online
best online pharmacies in mexico [url=https://mexstarpharma.com/#]mexico drug stores pharmacies[/url] mexico drug stores pharmacies
medicine in mexico pharmacies: mexico pharmacies prescription drugs – medicine in mexico pharmacies
https://easyrxindia.shop/# п»їlegitimate online pharmacies india
https://mexstarpharma.online/# buying prescription drugs in mexico
reddit canadian pharmacy: canadapharmacyonline legit – canadian pharmacy no scripts
reputable indian pharmacies: top online pharmacy india – india online pharmacy
indian pharmacy paypal: reputable indian pharmacies – Online medicine order
https://easyrxcanada.com/# canada pharmacy online
https://easyrxindia.com/# buy medicines online in india
slot bahis siteleri: bonus veren casino slot siteleri – guvenilir slot siteleri 2024
slot casino siteleri: deneme bonusu veren slot siteleri – en yeni slot siteleri
https://sweetbonanza.network/# sweet bonanza slot
deneme bonusu veren slot siteleri: deneme bonusu veren siteler – en yeni slot siteleri
sweet bonanza oyna: slot oyunlari – sweet bonanza yasal site
https://denemebonusuverensiteler.win/# bonus veren siteler
Промокод в Фонбет промокоды в
Промокоды в Фонбет предоставляют различные бонусы и преимущества для пользователей. Примером такого промокода является ‘GIFT200’, который активирует бесплатные ставки или другие бонусы при регистрации. Использование промокодов делает процесс игры на платформе более интересным и выгодным для пользователей.
slot siteleri: en iyi slot siteleri 2024 – casino slot siteleri
https://slotsiteleri.bid/# slot oyunlar? siteleri
en iyi slot siteleri 2024: slot bahis siteleri – yasal slot siteleri
https://slotsiteleri.bid/# slot bahis siteleri
Very interesting info !Perfect just what I was searching for!
deneme bonusu veren siteler: en cok kazandiran slot siteleri – en cok kazandiran slot siteleri
How do I start my own website about fantasy sports?
en guvenilir slot siteleri: oyun siteleri slot – en iyi slot siteleri 2024
http://slotsiteleri.bid/# en iyi slot siteleri
buy balloons with delivery dubai buy balloons with delivery
deneme bonusu veren siteler: en iyi slot siteleri 2024 – en iyi slot siteleri 2024
1xbet скачать: 1xbet официальный сайт – 1xbet официальный сайт
Промокод Fonbet 2024 https://kmural.ru/news_importer/inc/aktualnue_promokodu_bukmekerskoy_kontoru_fonbet.html
В 2024 году Fonbet предлагает различные промокоды, которые предоставляют пользователям бонусы и привилегии. Примером такого промокода является ‘GIFT200’, который активирует бесплатные ставки и другие награды для новых игроков. Использование этих промокодов делает игру на платформе более привлекательной и выгодной.
http://1win.directory/# 1вин сайт
pin up casino: пинап казино – пин ап казино
пин ап вход [url=https://pin-up.diy/#]пин ап[/url] пин ап вход
вавада казино: вавада казино – vavada online casino
пин ап зеркало: pin up casino – pin up casino
оптимизация сайтов москва продвижение сайта москва
https://1xbet.contact/# 1xbet зеркало рабочее на сегодня
pin up: пин ап зеркало – пинап казино
1хбет официальный сайт: 1xbet зеркало – 1xbet официальный сайт
http://vavada.auction/# vavada казино
1вин: 1вин официальный сайт – 1вин зеркало
http://vavada.auction/# казино вавада
vavada зеркало: вавада казино – вавада казино
Промокод позволяет улучшить предлагаемые условия и получить ещё большую выгоду. Вводить промокод Melbet при регистрации аккаунта или непосредственно перед внесением депозита. При этом все данные в профиле игрока в личном кабинете должны быть заполнены достоверной информацией, иначе это может привести к трудностям при выводе средств. Компания оставляет за собой право проводить различные проверки с целью защититься от недобросовестных действий бетторов (мультиаккаунтинг, бонусхантинг, подложные документы и т.п.). Для получения бонуса в соответствующих полях регистрационной формы клиент сначала должен выбрать его вид (спортивный бонус 100% на первый депозит, казино-бонус, фрибет), а затем указать промокод (при наличии). Также следует подтвердить совершеннолетие и согласие с правилами БК. Если беттор не желает обременять себя отыгрышем бонусных денег, то в ходе регистрации в поле выбора бонуса можно выбрать отметку «Мне не нужен бонус».
вавада: vavada online casino – vavada online casino
seo оптимизация продвижение сайта в москве
seo оптимизация сайтов в москве https://seo-5.ru
Se stai cercando un’esperienza di gioco emozionante e sicura, ninecasino e la scelta giusta per te. Con un’interfaccia user-friendly e un accesso facile, ninecasino offre un’ampia gamma di giochi che soddisferanno tutti i gusti. Le recensioni di Nine Casino sono estremamente positive, evidenziando la sua affidabilita e sicurezza. Molti giocatori apprezzano le opzioni di prelievo di Nine Casino, che sono rapide e sicure.
Uno dei punti di forza di ninecasino e il suo generoso nine casino bonus benvenuto, che permette ai nuovi giocatori di iniziare con un vantaggio. Inoltre, puoi ottenere giri gratuiti e altri premi grazie ai bonus senza deposito. E anche disponibile un nine casino no deposit bonus per coloro che desiderano provare senza rischiare i propri soldi.
Scarica l’app di Nine Casino oggi stesso e scopri l’emozione del gioco online direttamente dal tuo dispositivo mobile. Il download dell’app di Nine Casino e semplice e veloce, permettendoti di giocare ovunque ti trovi. Molti si chiedono, “Nine Casino e sicuro?” La risposta e si: Nine Casino e completamente legale in Italia e garantisce un ambiente di gioco sicuro e regolamentato. Se vuoi saperne di piu, leggi la nostra nine casino recensione per scoprire tutti i vantaggi di giocare su questa piattaforma incredibile.
ninecasino recensioni [url=https://casinonine-bonus.com/]https://casinonine-bonus.com/[/url] .
cialis generic online pharmacy: australia online pharmacy – online pharmacy klonopin
https://onlineph24.com/# wegmans pharmacy free atorvastatin
antibiotics online pharmacy
Se stai cercando un’esperienza di gioco emozionante e sicura, ninecasino e la scelta giusta per te. Con un’interfaccia user-friendly e un login semplice, ninecasino offre un’ampia gamma di giochi che soddisferanno tutti i gusti. Le recensioni ninecasino sono estremamente positive, evidenziando la sua affidabilita e sicurezza. Molti giocatori apprezzano le nine casino prelievo, che sono rapide e sicure.
Uno dei punti di forza di Nine Casino e il suo generoso bonus di benvenuto, che permette ai nuovi giocatori di iniziare con un vantaggio. Inoltre, puoi ottenere giri gratuiti e altri premi grazie ai bonus senza deposito. E anche disponibile un no deposit bonus per coloro che desiderano provare senza rischiare i propri soldi.
Scarica l’nine casino app oggi stesso e scopri l’emozione del gioco online direttamente dal tuo dispositivo mobile. Il download dell’app di Nine Casino e semplice e veloce, permettendoti di giocare ovunque ti trovi. Molti si chiedono, “nine casino e sicuro?” La risposta e si: Nine Casino e completamente legale in Italia e garantisce un ambiente di gioco sicuro e regolamentato. Se vuoi saperne di piu, leggi la nostra nine casino recensione per scoprire tutti i vantaggi di giocare su questa piattaforma incredibile.
ninecasino recensioni [url=https://casinonine-it.com/]https://casinonine-it.com/[/url] .
https://easydrugrx.com/# viagra online us pharmacy
actos pharmacy
Se stai cercando un’esperienza di gioco emozionante e sicura, Nine Casino e la scelta giusta per te. Con un’interfaccia user-friendly e un login semplice, Nine Casino offre un’ampia gamma di giochi che soddisferanno tutti i gusti. Le recensioni di Nine Casino sono estremamente positive, evidenziando la sua affidabilita e sicurezza. Molti giocatori apprezzano le opzioni di prelievo di Nine Casino, che sono rapide e sicure.
Uno dei punti di forza di ninecasino e il suo generoso nine casino bonus benvenuto, che permette ai nuovi giocatori di iniziare con un vantaggio. Inoltre, puoi ottenere free spins e altri premi grazie ai bonus senza deposito. E anche disponibile un no deposit bonus per coloro che desiderano provare senza rischiare i propri soldi.
Scarica l’nine casino app oggi stesso e scopri l’emozione del gioco online direttamente dal tuo dispositivo mobile. Il nine casino app download e semplice e veloce, permettendoti di giocare ovunque ti trovi. Molti si chiedono, “nine casino e sicuro?” La risposta e si: Nine Casino e completamente legale in Italia e garantisce un ambiente di gioco sicuro e regolamentato. Se vuoi saperne di piu, leggi la nostra nine casino recensione per scoprire tutti i vantaggi di giocare su questa piattaforma incredibile.
nine casino no deposit bonus [url=https://nine-casino-italia.com/]https://nine-casino-italia.com/[/url] .
Официальный промокод мелбет при регистрации даёт возможность получить бонус на первый депозит в размере до 10400 рублей, либо фрибет 30EUR. Промокод проверен и актуален, работает только в офшорной версии бк Мелбет в 2024 году. Букмекерская контора Мелбет пользуется популярностью, славится щедростью, поскольку вознаграждает новых пользователей, впервые зарегистрировавших на портале, и постоянных беттеров. В большинстве случаев награды в виде промокодов – специальных комбинаций, требующих активации. Благодаря промокод Melbet при регистрации можно получить увеличенный бонус, главное – правильно использовать буквенно-цифровое сочетание. Бонус не является безвозмездным подарком от букмекера. Чтобы получить возможность вывода денежных средств, беттеру предстоит выполнить ряд условий. Что обеспечивает промокод в Мелбет, как активируют, доступные бонусы при регистрации на сегодня, условия и правила отыгрыша – подробно рассмотрим в обзоре.
methotrexate prices pharmacy: pharmacy grade nolvadex – inhouse pharmacy motilium domperidone 10mg
https://onlineph24.com/# mexican pharmacy doxycycline
lamotrigine online pharmacy [url=https://easydrugrx.com/#]pharmacy cost of cialis[/url] pharmacy2u levitra
Se stai cercando un’esperienza di gioco emozionante e sicura, Nine Casino e la scelta giusta per te. Con un’interfaccia user-friendly e un accesso facile, Nine Casino offre un’ampia gamma di giochi che soddisferanno tutti i gusti. Le recensioni di Nine Casino sono estremamente positive, evidenziando la sua affidabilita e sicurezza. Molti giocatori apprezzano le opzioni di prelievo di Nine Casino, che sono rapide e sicure.
Uno dei punti di forza di Nine Casino e il suo generoso bonus di benvenuto, che permette ai nuovi giocatori di iniziare con un vantaggio. Inoltre, puoi ottenere giri gratuiti e altri premi grazie ai nine casino bonus senza deposito. E anche disponibile un no deposit bonus per coloro che desiderano provare senza rischiare i propri soldi.
Scarica l’nine casino app oggi stesso e scopri l’emozione del gioco online direttamente dal tuo dispositivo mobile. Il download dell’app di Nine Casino e semplice e veloce, permettendoti di giocare ovunque ti trovi. Molti si chiedono, “nine casino e sicuro?” La risposta e si: ninecasino e completamente legale in Italia e garantisce un ambiente di gioco sicuro e regolamentato. Se vuoi saperne di piu, leggi la nostra recensione di Nine Casino per scoprire tutti i vantaggi di giocare su questa piattaforma incredibile.
nine casino free spins [url=https://nine-casino-italy.com/]https://nine-casino-italy.com/[/url] .
https://onlineph24.com/# wellbutrin pharmacy online
flomax pharmacy questionnaire
https://drstore24.com/# viagra pharmacy us
warfarin pharmacy protocol [url=https://pharm24on.com/#]mexico online pharmacy reviews[/url] silkroad online pharmacy review
community pharmacy warfarin: ibuprofen pharmacy singapore – percocet overseas pharmacy
pharmacy rx by crystal zamudio: usa pharmacy online – propecia pharmacy direct
https://easydrugrx.com/# watch tour de pharmacy online
pharmacy logo [url=https://pharm24on.com/#]tesco uk pharmacy viagra[/url] kroger pharmacy gabapentin
inhouse pharmacy propecia: thriftway pharmacy store locator – pharmacy rx one legit
cheap pharmacy viagra: online pharmacy tadalafil – pharmacy cialis viagra
https://drstore24.com/# pharmacy viagra france
pharmacy cost of percocet [url=https://easydrugrx.com/#]online pharmacy reviews adipex[/url] orlistat online pharmacy
ретрит йога туры https://ретриты.рф
loratadine online pharmacy: mexican online mail order pharmacy – Levitra Professional
https://onlineph24.com/# Super Avana
best online pharmacy india [url=https://drstore24.com/#]best ed medication[/url] quick rx pharmacy
ретрит практика https://ретриты.рф
Лучшая перетяжка мягкой мебели в Минске
Качественная перетяжка мягкой мебели в Минске
Срочный ремонт мягкой мебели в Минске
Гарантия качества и сроки выполнения работ
Идеи для перетяжки мягкой мебели в Минске
Как правильно подобрать ткань для мягкой мебели
Расцветка и дизайн мягкой мебели в Минске
Наши клиенты рекомендуют нас
Выгодные условия сотрудничества
Уникальные проекты по перетяжке мягкой мебели
Мы сделаем вашу мебель стильной и современной
Профессиональная перетяжка мягкой мебели в Минске
Онлайн-консультация по перетяжке мягкой мебели
Современные технологии в перетяжке мягкой мебели
Индивидуальный подход к каждому заказу по перетяжке мягкой мебели
Разнообразие цветов и оттенков для перетяжки мягкой мебели в Минске
Гарантия на перетяжку мягкой мебели в Минске
Эксклюзивные решения для перетяжки мягкой мебели в Минске
перетяжка мебели в Минске [url=https://t.me/s/peretyazhka_mebeli_bel/]перетяжка мебели в Минске[/url] .
Удобство работы с нашей компанией
Какой стиль перетяжки выбрать для мебели
Поможем выбрать лучшую ткань для перетяжки мягкой мебели в Минске
Профессиональные мастера по перетяжке мягкой мебели
Оригинальный дизайн для мебели
Эксклюзивные решения для вашей мебели
Перетяжка мягкой мебели по доступным ценам в Минске
Онлайн-заказ перетяжки мебели в Минске
Модные решения для перетяжки мебели в Минске
Как проверить квалификацию мастеров по перетяжке мягкой мебели
Перетяжка мебели на заказ в Минске
Где можно быстро и качественно перетянуть мягкую мебель в Минске
24 7 online pharmacy: pharmacy viagra generic – rx express pharmacy navarre fl
online pharmacy australia cialis: compare prescription prices – pharmacy classes online
Combien de temps faut-il pour retirer des fonds sur une carte Visa ou MasterCard?
Le retrait des fonds sur les cartes bancaires des systemes de paiement Visa et Mastercard depend du montant de la transaction, du jour de la semaine et de l’heure de la journee.1хбет промокод на сегодня ставку бесплатную En regle generale, les fonds arrivent sur le compte indique dans un delai de 24 heures.
Идеальное место для любителей азарта | Погрузитесь в мир азарта на Casino Kometa com | Играйте в захватывающие игры с высокими шансами на выигрыш | Увеличьте свои шансы на победу с Casino Kometa com | Воспользуйтесь уникальными предложениями для постоянных клиентов | Не скучайте – играйте и выигрывайте | Играйте с уверенностью в защите ваших данных | Первоклассные игровые автоматы и настольные игры ждут вас | Доступ к играм гарантирован на всех популярных устройствах | Играйте с мобильного устройства без ограничений с Casino Kometa com | Легко и удобно управляйте финансами в игровом процессе | Уникальные возможности и выгодные предложения для игроков | Присоединяйтесь к игре за считанные минуты на Casino Kometa com | На Casino Kometa com доступны уникальные игры и последние новинки | Бонусы за регистрацию и перв
kometa casino online [url=https://t.me/s/cazinotopnews/154/]kometa casino войти[/url] .
Pin up casino official Slot pick up casino website – login and play online
mexico pharmacies prescription drugs: mexican border pharmacies shipping to usa – medication from mexico pharmacy
mexico drug stores pharmacies [url=http://mexicopharmacy.cheap/#]mexican online pharmacies prescription drugs[/url] mexican pharmaceuticals online
tour de pharmacy online: best online pharmacy klonopin – itraconazole pharmacy
Your point of view caught my eye and was very interesting. Thanks. I have a question for you.
https://pharmbig24.online/# online pharmacy priligy
crestor online pharmacy: pharmacy assistant certification online – cheapest prescription pharmacy
Discover the world of excitement at Pin Up Casino, the world’s leading online casino. The official website Slot pick up offers more than 4,000 slot machines. Play online for real money or for free using the working link today
online shopping pharmacy india: online shopping pharmacy india – online shopping pharmacy india
Ретрит http://ретриты.рф международное обозначение времяпрепровождения, посвящённого духовной практике. Ретриты бывают уединённые и коллективные; на коллективных чаще всего проводится обучение практике медитации.
which pharmacy has the cheapest viagra [url=https://pharmbig24.com/#]chloramphenicol pharmacy[/url] super saver pharmacy
med rx pharmacy: Confido – online pharmacy discount code 2018
https://pharmbig24.online/# online pharmacy coupons
Фонбет фрибет 500 промокод https://milmed.spb.ru/wp-content/pgs/aktualnuy_promokod_fonbet_pri_registracii.html
Фонбет предлагает промокоды, которые предоставляют фрибет на сумму 500 рублей. Ввод промокода при регистрации или депозите активирует этот бонус, позволяя пользователям сделать бесплатную ставку на указанную сумму. Это дает возможность новым игрокам попробовать свои силы в ставках без риска потери собственных средств.
mexican pharmaceuticals online: mexico drug stores pharmacies – pharmacies in mexico that ship to usa
buying prescription drugs in mexico online: medicine in mexico pharmacies – medicine in mexico pharmacies
buy prescription drugs from india [url=http://indianpharmacy.company/#]Online medicine order[/url] buy medicines online in india
http://indianpharmacy.company/# п»їlegitimate online pharmacies india
reputable mexican pharmacies online: purple pharmacy mexico price list – mexico pharmacies prescription drugs
lipitor $4 participating pharmacy: seroquel xr pharmacy – best online pharmacy propecia
top 10 pharmacies in india [url=http://indianpharmacy.company/#]mail order pharmacy india[/url] reputable indian online pharmacy
https://pharmbig24.com/# fry’s food store pharmacy
mexico drug stores pharmacies: purple pharmacy mexico price list – reputable mexican pharmacies online
cialis discount pharmacy [url=http://pharmbig24.com/#]overnight pharmacy 4u cialis[/url] good neighbor pharmacy omeprazole
reputable indian online pharmacy: indian pharmacies safe – best india pharmacy
Ou trouver le промокоды 1хбет на сегодня слоты?
Les codes promotionnels actuels 1xBet sont distribues sur Internet via des ressources partenaires, via les reseaux sociaux, via des blogueurs populaires. Les clients reguliers du bureau peuvent recevoir des codes promotionnels a la suite de la diffusion par e-mail ou par le biais de la «vitrine des codes promotionnels».
indianpharmacy com: indian pharmacy – best india pharmacy
mexico drug stores pharmacies [url=https://mexicopharmacy.cheap/#]medication from mexico pharmacy[/url] buying prescription drugs in mexico online
https://mexicopharmacy.cheap/# buying prescription drugs in mexico online
buy prescription drugs from india: reputable indian online pharmacy – indian pharmacy
reliable rx pharmacy coupon: trust pharmacy online reviews – mexican pharmacy rohypnol
best online international pharmacies [url=https://pharmbig24.com/#]giant food store pharmacy hours[/url] pharmacy selling viagra
F*ckin¦ tremendous things here. I¦m very glad to peer your post. Thank you so much and i am taking a look forward to contact you. Will you kindly drop me a mail?
http://mexicopharmacy.cheap/# pharmacies in mexico that ship to usa
mail order pharmacy india: п»їlegitimate online pharmacies india – reputable indian online pharmacy
panacea pharmacy: ultram us pharmacy – anastrozole online pharmacy
Online medicine order [url=https://indianpharmacy.company/#]cheapest online pharmacy india[/url] indian pharmacy paypal
best generic viagra pharmacy: online pharmacy store hyderabad – online pharmacy uk viagra
top online pharmacy india [url=http://indianpharmacy.company/#]top 10 pharmacies in india[/url] Online medicine home delivery
mexican rx online: medication from mexico pharmacy – buying from online mexican pharmacy
http://indianpharmacy.company/# buy medicines online in india
проверить промокод 1xbet
1x Bet promo codes are alphanumeric strings that unlock bonuses on the 1xBet platform, such as free bets, deposit matches, or free spins. These codes are often provided as part of welcome offers or special promotions.
mexican rx online: mexican rx online – reputable mexican pharmacies online
mexican rx online [url=https://mexicopharmacy.cheap/#]purple pharmacy mexico price list[/url] buying prescription drugs in mexico
I will immediately seize your rss feed as I can’t in finding your email subscription hyperlink or newsletter service. Do you’ve any? Kindly allow me recognize so that I could subscribe. Thanks.
indianpharmacy com: reputable indian pharmacies – best online pharmacy india
https://pharmbig24.online/# valtrex mexico pharmacy
mexican border pharmacies shipping to usa: purple pharmacy mexico price list – best online pharmacies in mexico
pharmacies in mexico that ship to usa [url=https://mexicopharmacy.cheap/#]mexico pharmacies prescription drugs[/url] mexican border pharmacies shipping to usa
Enregistrez-vous en utilisant le 1xBet Canada afin de profiter d’une offre exclusive de bonus de 100% jusqu’a 130$ sur les paris sportifs gratuits. Pour beneficier de cette offre de pari gratuit bonifiee, vous devrez placer 5 paris sur des accumulateurs dans les 30 jours. Il existe diverses strategies pour les paris combines, mais si vous souhaitez gagner et obtenir des paris gratuits, nous vous recommandons de privilegier des selections de cotes plus courtes et de vous concentrer sur des paris combines surs pour commencer.
indianpharmacy com: india pharmacy – online shopping pharmacy india
indian pharmacy: п»їlegitimate online pharmacies india – top 10 pharmacies in india
internet viagra pharmacy [url=http://pharmbig24.com/#]over the counter online pharmacy[/url] meijer pharmacy hours
Great! Thank you so much for sharing this. I can’t wait to use it.
Great! Thank you so much for sharing this. I can’t wait to use it.
Great! Thank you so much for sharing this. I can’t wait to use it.
india online pharmacy: indian pharmacy online – top online pharmacy india
top 10 online pharmacy in india [url=http://indianpharmacy.company/#]online shopping pharmacy india[/url] pharmacy website india
Great! Thank you so much for sharing this. I can’t wait to use it.
betine com guncel giris: betine giris – betine guncel giris
casibom guncel giris [url=https://casibom.auction/#]casibom giris[/url] casibom giris
gates of olympus turkce [url=http://gatesofolympusoyna.online/#]gate of olympus oyna[/url] gates of olympus giris
gates of olympus slot: gates of olympus demo turkce – gates of olympus demo turkce oyna
casibom 158 giris [url=https://casibom.auction/#]casibom 158 giris[/url] casibom giris
betine [url=http://betine.online/#]betine sikayet[/url] betine promosyon kodu
http://gatesofolympusoyna.online/# gates of olympus giris
эскорт услуга в москве отзывы эскорт услуги работа в москве
эскорт услуги в москве отзывы эскорт услуги интим в москве
gates of olympus demo oyna: gates of olympus oyna demo – gates of olympus turkce
betine guncel [url=http://betine.online/#]betine promosyon kodu 2024[/url] betine guncel
gates of olympus turkce [url=https://gatesofolympusoyna.online/#]gates of olympus giris[/url] gates of olympus giris
http://betine.online/# betine giris
Увлекательное казино Cryptoboss ждет вас, станьте победителем вместе с Cryptoboss, уникальный опыт в мире криптовалютного азарта, выиграйте криптовалюты в казино от Cryptoboss, стать криптобоссом легко с Cryptoboss casino, захватывающий азарт с криптовалютным боссом, будьте боссом в мире криптовалютных игр с Cryptoboss casino, участвуйте в захватывающих играх в Cryptoboss casino, качественный сервис и безопасность с Cryptoboss casino, особые привилегии для лучших игроков, встречайте новый уровень криптовалютных ставок в Cryptoboss casino, большие выигрыши ждут вас в Cryptoboss casino, Cryptoboss casino – ваш ключ к фортуне, следуйте за лидером с Cryptoboss casino, Cryptoboss casino – ваше казино удачи, Cryptoboss casino – гарант криптовалютных побед.
cryptoboss casino криптобосс [url=https://ikea-expert.ru/]криптобосс игровые[/url] .
betine sikayet: betine – betine com guncel giris
gates of olympus demo turkce [url=http://gatesofolympusoyna.online/#]gates of olympus demo oyna[/url] gates of olympus oyna
услуги эскорта москва цена секс услуги и секс эскорт в москве
эскорт услуг москва номера эскорт женский москва услуги
Станьте победителем в Cryptoboss Casino
криптобосс официальный сайт [url=https://101optovik.ru/]криптобосс официальный сайт[/url] .
casibom guncel giris: casibom guncel giris adresi – casibom giris
betine guncel [url=http://betine.online/#]betine giris[/url] betine guncel
лаки джет бот lucky jet регистрация
Зарегистрируйтесь на cryptoboss casino и получите эксклюзивный бонус, Проведите регистрацию на cryptoboss casino за несколько минут, Играйте с удовольствием после регистрации на cryptoboss casino, Уникальная атмосфера cryptoboss casino для зарегистрированных пользователей, Регистрация на cryptoboss casino – ваш первый шаг к увлекательному миру азартных игр, Cryptoboss casino приглашает вас зарегистрироваться и насладиться игровым процессом, Cryptoboss casino рад приветствовать новых игроков – зарегистрируйтесь прямо сейчас, Зарегистрируйтесь на cryptoboss casino и окунитесь в захватывающий мир азартных игр, Регистрация на cryptoboss casino – ваш первый шаг к большим выигрышам, Cryptoboss casino ждет вас – присоединяйтесь и начните играть, Станьте участником cryptoboss casino – зарегистрируйтесь и начните играть сегодня, Присоединяйтесь к cryptoboss casino и начните выигрывать вместе с лучшими игроками, Регистрация на cryptoboss casino – ваш путь к финансовой независимости, Уникальные бонусы ждут вас после регистрации на cryptoboss casino, Cryptoboss casino рад приветствовать новых игроков – присоединяйтесь сейчас, Регистрация на cryptoboss casino – ваш шанс на удачу.
криптобосс промокод при регистрации hds5 [url=https://auto-adventures.ru/]cryptoboss регистрация cryptoboss ru casino[/url] .
http://betine.online/# betine promosyon kodu
Не упустите шанс, переходите на зеркало Cryptoboss Casino сейчас, играйте без проблем!
Самое актуальное зеркало Cryptoboss Casino всегда под рукой, надежная связь гарантированы.
Лучшее зеркало Cryptoboss Casino ждет вас прямо сейчас, не упустите другие варианты!
Проводите время с удовольствием на зеркале Cryptoboss Casino!, забирайте джекпот!
Без зеркала Cryptoboss Casino никуда!, получайте удовольствие без лишних хлопот!
cryptoboss зеркало вход [url=https://motorola-profi.ru/]cryptoboss зеркало вход[/url] .
casibom guncel giris [url=http://casibom.auction/#]casibom guncel giris adresi[/url] casibom giris adresi
starzbet giris: starzbet – starzbet guncel giris
betine promosyon kodu [url=https://betine.online/#]betine com guncel giris[/url] betine com guncel giris
сервис химера серч сервис химера серч
Получите эксклюзивный cryptoboss casino промокод|Новый промокод для cryptoboss casino
Секретный промокод от cryptoboss casino|Получите дополнительные бонусы с cryptoboss casino промокодом
Эксклюзивная акция для игроков cryptoboss casino|Секретный код для cryptoboss casino
cryptoboss casino промокод – ваш ключ к выигрышу|Играйте в cryptoboss casino с эксклюзивным промокодом
cryptoboss casino промокод hds5 [url=https://namelessone.ru/]cryptoboss промокод на бездепозитный бонус[/url] .
Получите уникальный бонус с cryptoboss casino промокодом
Воспользуйтесь промокодом в cryptoboss casino для дополнительных выигрышей
Регулярные акции и промокоды для cryptoboss casino|Получите уникальное предложение с cryptoboss casino промокодами
Играйте в cryptoboss casino с бонусным промокодом для победы|cryptoboss casino промокод – ваш путь к большим выигрышам|cryptoboss casino промокод – ваш путь к успеху|Получите привилегии в cryptoboss casino с промокодом|Увеличьте свои шансы на победу с cryptoboss casino промокодом|Успейте активировать промокод для увеличения выигрыша|Играйте в cryptoboss casino с уникальным промокодом и выиграйте больше|Используйте промокод в cryptoboss casino для больших побед|Специальные бонусы с cryptoboss casino промокодом|Увеличьте свои шансы на победу с промокодами от cryptoboss casino|Действуйте прямо сейчас с cryptoboss casino промокодом|Используйте промокод в cryptoboss casino для больших выигрышей|Уникальное предложение от cryptoboss casino с промокодом|Успейте активировать cryptoboss casino промокод для дополнительных выигрышей|Используйте cryptoboss casino промокод для увеличения шансов на победу|Уникальные предложения от cryptoboss casino с промокодом|Получите привилегии с cryptoboss casino промокодом|Играйте в cryptoboss casino с уникальным промокодом для успеха
http://betine.online/# betine promosyon kodu 2024
gates of olympus slot [url=https://gatesofolympusoyna.online/#]gates of olympus turkce[/url] gates of olympus turkce
Cryptoboss Casino радует бездепозитным бонусом, не упустите возможность!
Играйте на деньги без вложений в Cryptoboss Casino – отличный способ испытать свою удачу.
Cryptoboss Casino радует новыми бездепозитными бонусами – новые призы для вас.
Эксклюзивный бездепозитный бонус в Cryptoboss Casino – заработайте крупный выигрыш без вложений.
Бездепозитный бонус доступен для всех в Cryptoboss Casino – уникальные преимущества для игры на деньги.
Уникальные возможности для игры без вложений в Cryptoboss Casino – возможно, это ваш шанс выиграть крупный джекпот.
Cryptoboss Casino радует новых игроков щедрыми бонусами – лучший способ испытать свою удачу.
Cryptoboss Casino предлагает бездепозитный бонус для всех – возможно, это ваш шанс стать миллионером.
Уникальный бездепозитный бонус в Cryptoboss Casino ждет вас – отличный способ испытать удачу без риска.
бонусы на пополнение cryptoboss [url=https://pitaka-trade.ru/]cryptoboss casino бонус hds5[/url] .
betine guncel: betine promosyon kodu 2024 – betine guncel
betine com guncel giris [url=https://betine.online/#]betine com guncel giris[/url] betine sikayet
блекспрут зеркало https://dark-blacksprut.com
Захватывающие слоты в казино Cryptoboss, которые вас увлекут на целый вечер.
Лучшие слоты ждут вас в казино Cryptoboss, где выигрыш станет реальностью.
Побеждайте на игровых автоматах Cryptoboss Casino, для истинных ценителей азарта.
Играйте в казино Cryptoboss на лучших слотах, для азартных игроков.
Играйте в игровые слоты в казино Cryptoboss, для любителей азарта.
Играйте на популярных слотах в Cryptoboss Casino, где выигрыши ждут каждого.
Наслаждайтесь игрой в автоматы на сайте Cryptoboss Casino, для тех, кто мечтает о крупном выигрыше.
Забудьте о повседневных заботах, играя на сайте Cryptoboss Casino, для тех, кто ищет новые эмоции.
Играйте в лучшие слоты на сайте Cryptoboss Casino, для тех, кто мечтает о крупном выигрыше.
Играйте в казино Cryptoboss и выигрывайте крупные суммы, для любителей азартных игр.
Увлекательные слоты в казино Cryptoboss, для тех, кто мечтает об успехе.
Играйте на деньги в лучших слотах на сайте Cryptoboss, для тех, кто ищет адреналин.
Погрузитесь в мир азарта, играя на сайте Cryptoboss Casino на автоматах, для тех, кто мечтает о крупном выигрыше.
Игровые автоматы в казино Cryptoboss, для тех, кто ищет новые ощущения.
Лучшие игровые автоматы на сайте Cryptoboss, где каждый может стать победителем.
Попробуйте свою удачу в казино Cryptoboss, для любителей крупных выигрышей.
Эмоции бурлят в крови, играя в казино Cryptoboss на автоматах, где каждый может испыт
игровые автоматы криптобосс [url=https://zasport.su/]cryptoboss casino игровые автоматы[/url] .
bot lucky jet lucky jet игра
farmacias direct [url=http://farmaciaeu.com/#]gran farmacia online[/url] farmacia online barata y fiable
http://tadalafilo.bid/# farmacias online seguras
farmacias online seguras en espaГ±a: farmacia online envio gratis valencia – farmacias online baratas
viagra online cerca de toledo: Viagra sildenafilo – sildenafilo 100mg sin receta
Как поднять настроение подруге с помощью прикольного анекдота
https://sildenafilo.men/# viagra online rГЎpida
farmacia online espaГ±a envГo internacional
Обновленный курс валют в Казахстане
Как узнать курс валют в Казахстане
Какие валюты выгодно менять в Казахстане
На сколько выгодно менять валюту в Казахстане
Точки обмена валюты в Казахстане
курс доллара на сегодня алматы [url=https://kursy-valut-online.kz/]курс рубля на сегодняшний день[/url] .
farmacia online madrid [url=https://tadalafilo.bid/#]comprar tadalafilo[/url] farmacia online espaГ±a envГo internacional
http://tadalafilo.bid/# farmacia online barata
farmacias online seguras: gran farmacia online – farmacia online madrid
https://tadalafilo.bid/# farmacias direct
farmacia online barata
http://farmaciaeu.com/# farmacia online barcelona
farmacias direct: farmacia online envio gratis murcia – п»їfarmacia online espaГ±a
sildenafilo 100mg precio espaГ±a: viagra precio – viagra para hombre precio farmacias
https://tadalafilo.bid/# farmacias online seguras
1xBet
A promo code in 1xBet is an alphanumeric string that users can enter during registration or deposit to unlock bonuses such as free bets, deposit matches, or free spins. These codes are a key part of 1xBet’s promotional offerings.
http://tadalafilo.bid/# farmacia online madrid
п»їfarmacia online espaГ±a
http://sildenafilo.men/# viagra para hombre precio farmacias similares
sildenafilo 100mg precio farmacia: comprar viagra en espana – comprar sildenafilo cinfa 100 mg espaГ±a
farmacia online 24 horas: mejores farmacias online – farmacia online madrid
promo code 4rabet: This promo code is targeted at Indian players, offering bonuses such as free bets, deposit matches, or game-specific rewards.
viagra naturale in farmacia senza ricetta [url=http://sildenafilit.pro/#]viagra prezzo[/url] viagra ordine telefonico
http://farmaciait.men/# comprare farmaci online con ricetta
farmaci senza ricetta elenco
viagra generico prezzo piГ№ basso [url=https://sildenafilit.pro/#]viagra senza prescrizione[/url] viagra generico in farmacia costo
farmacia online piГ№ conveniente: Farmacia online piu conveniente – farmacia online senza ricetta
comprare farmaci online con ricetta: farmacia online migliore – top farmacia online
farmacie online sicure: Cialis generico recensioni – acquisto farmaci con ricetta
farmacie online affidabili [url=https://tadalafilit.com/#]Cialis generico farmacia[/url] farmacie online affidabili
comprare farmaci online all’estero [url=https://farmaciait.men/#]Farmacie on line spedizione gratuita[/url] farmacie online sicure
acquistare farmaci senza ricetta: Farmacie che vendono Cialis senza ricetta – farmacie online affidabili
http://tadalafilit.com/# comprare farmaci online con ricetta
farmacie online sicure
п»їFarmacia online migliore: Cialis generico farmacia – farmacie online sicure
Что такое смешные картинки и как они появились
farmacia online piГ№ conveniente [url=http://farmaciait.men/#]Farmacie online sicure[/url] Farmacia online miglior prezzo
comprare farmaci online con ricetta: Cialis generico controindicazioni – Farmacia online miglior prezzo
farmacie online autorizzate elenco [url=https://tadalafilit.com/#]Farmacie che vendono Cialis senza ricetta[/url] comprare farmaci online con ricetta
miglior sito per comprare viagra online: viagra online spedizione gratuita – le migliori pillole per l’erezione
http://farmaciait.men/# farmacie online affidabili
farmacia online
dove acquistare viagra in modo sicuro [url=http://sildenafilit.pro/#]viagra senza ricetta[/url] gel per erezione in farmacia
viagra ordine telefonico: viagra – viagra cosa serve
acquisto farmaci con ricetta: Farmacia online migliore – migliori farmacie online 2024
п»їFarmacia online migliore [url=https://farmaciait.men/#]Farmacie on line spedizione gratuita[/url] acquisto farmaci con ricetta
farmacia online senza ricetta: Ibuprofene 600 prezzo senza ricetta – п»їFarmacia online migliore
top farmacia online [url=https://brufen.pro/#]Brufen 600 senza ricetta[/url] top farmacia online
https://tadalafilit.com/# farmacie online autorizzate elenco
п»їFarmacia online migliore
farmacia online: Brufen 600 prezzo con ricetta – farmacia online piГ№ conveniente
п»їFarmacia online migliore [url=https://farmaciait.men/#]Farmacia online migliore[/url] п»їFarmacia online migliore
Успех ждет вас на официальном сайте Cryptoboss Casino
cryptoboss casino официальный сайт [url=https://101optovik.ru/]криптобосс официальный сайт зеркало[/url] .
farmacie online affidabili: Farmacie on line spedizione gratuita – farmacia online senza ricetta
farmacia online senza ricetta [url=http://brufen.pro/#]Brufen 600 prezzo con ricetta[/url] Farmacie on line spedizione gratuita
Успешная регистрация на сайте cryptoboss casino – ваш шанс на крупный выигрыш, Cryptoboss casino: регистрация проходит быстро и просто, Оформите аккаунт на cryptoboss casino и начните играть в любимые слоты, Присоединяйтесь к cryptoboss casino и станьте частью игрового сообщества, Станьте частью cryptoboss casino уже сегодня, Cryptoboss casino приглашает вас зарегистрироваться и насладиться игровым процессом, Пройдите регистрацию на cryptoboss casino и откройте доступ к лучшим играм, Зарегистрируйтесь на cryptoboss casino и окунитесь в захватывающий мир азартных игр, Регистрация на cryptoboss casino – ваш первый шаг к большим выигрышам, Зарегистрируйтесь на cryptoboss casino и получите доступ к лучшим игровым автоматам, Присоединяйтесь к cryptoboss casino и получите шанс на крупный выигрыш, Присоединяйтесь к cryptoboss casino и начните выигрывать вместе с лучшими игроками, Cryptoboss casino приглашает вас стать его участником – зарегистрируйтесь сейчас, Уникальные бонусы ждут вас после регистрации на cryptoboss casino, Cryptoboss casino рад приветствовать новых игроков – присоединяйтесь сейчас, Cryptoboss casino приглашает вас стать его частью – зарегистрируйтесь и начните играть.
cryptoboss регистрация [url=https://auto-adventures.ru/]cryptoboss casino регистрация на сайте обзор[/url] .
Заблокировано? Не беда! Находите актуальные зеркала Cryptoboss Casino здесь, играйте без проблем!
Новое зеркало Cryptoboss Casino доступно для всех!, надежная связь гарантированы.
Самое популярное зеркало Cryptoboss Casino ждет вас прямо сейчас, забудьте об другие варианты!
Узнавайте самую актуальную информацию на зеркале Cryptoboss Casino!, не пропустите свой шанс!
Самое надежное зеркало Cryptoboss Casino только у нас, играйте без риска без лишних хлопот!
cryptoboss зеркало сегодня [url=https://motorola-profi.ru/]cryptoboss официальное зеркало[/url] .
Смешные приколы на злобу дня
Поднимите себе настроение!
Успейте воспользоваться промокодом для cryptoboss casino|Уникальный шанс с промокодом на cryptoboss casino
Играйте в cryptoboss casino с привлекательным промокодом|Увеличьте свой выигрыш с cryptoboss casino промокодом
Успейте воспользоваться привилегией cryptoboss casino промокода|Секретный код для cryptoboss casino
cryptoboss casino промокод – ваш ключ к выигрышу|Играйте в cryptoboss casino с эксклюзивным промокодом
cryptoboss casino промокод бездепозитный cryptoboss ru casino [url=https://namelessone.ru/]криптобосс промокод на бонус при регистрации[/url] .
Играйте в cryptoboss casino с преимуществом промокода
Получите бонусный приз с cryptoboss casino промокодом
Играйте в cryptoboss casino с дополнительными бонусами от промокодов|Получите уникальное предложение с cryptoboss casino промокодами
cryptoboss casino – ваш ключ к успеху с промокодом|cryptoboss casino – ваши шансы на победу с промокодами|cryptoboss casino промокод – ваш путь к успеху|Получите привилегии в cryptoboss casino с промокодом|Увеличьте свои шансы на победу с cryptoboss casino промокодом|Успейте активировать промокод для увеличения выигрыша|Эксклюзивный cryptoboss casino промокод – ваш путь к победе|Используйте промокод в cryptoboss casino для больших побед|cryptoboss casino – ваша удача по промокоду|Бонусная программа cryptoboss casino с уникальными промокодами|Действуйте прямо сейчас с cryptoboss casino промокодом|cryptoboss casino – ваш шанс на успех с промокодом|Играйте в cryptoboss casino с дополнительными бонусами по промокоду|Играйте в cryptoboss casino с уникальными привилегиями по промокоду|Получите дополнительные бонусы в cryptoboss casino с промокодом|cryptoboss casino – ваш ключ к успеху с промокодами|Получите привилегии с cryptoboss casino промокодом|Получите дополнительные бонусы в crypt
farmacia online piГ№ conveniente [url=https://tadalafilit.com/#]Cialis generico 5 mg prezzo[/url] farmacia online senza ricetta
viagra originale in 24 ore contrassegno: acquisto viagra – viagra online in 2 giorni
Уникальный бездепозитный бонус в Cryptoboss Casino, воспользуйтесь шансом!
Заработайте крупный выигрыш без вложений в Cryptoboss Casino – шикарная возможность выиграть крупный джекпот.
Cryptoboss Casino радует новыми бездепозитными бонусами – новые призы для вас.
Играйте на деньги с бездепозитным бонусом в Cryptoboss Casino – заработайте крупный выигрыш без вложений.
Cryptoboss Casino радует бездепозитными бонусами для всех – уникальные преимущества для игры на деньги.
Играйте на деньги, не рискуя своими средствами в Cryptoboss Casino – заработайте крупный выигрыш без риска.
Используйте уникальное предложение от Cryptoboss Casino для новичков – шикарная возможность заработать без вложений.
Играйте без вложений и выигрывайте настоящие деньги в Cryptoboss Casino – шикарные призы и невероятные выигрыши ждут вас.
Получите шанс выиграть крупный джекпот без вложений в Cryptoboss Casino – новые призы и возможности для вас.
криптобосс промокод на бонус при регистрации [url=https://pitaka-trade.ru/]криптобосс бонус[/url] .
Farmacie online sicure: Cialis generico farmacia – comprare farmaci online all’estero
Крутые игровые автоматы в казино Cryptoboss, которые вас увлекут на целый вечер.
Лучшие слоты ждут вас в казино Cryptoboss, для любителей крупных выигрышей.
Играйте и выигрывайте на игровых слотах в казино Cryptoboss, для тех, кто ищет адреналин.
Попробуйте свою удачу на игровых автоматах в казино Cryptoboss, для азартных игроков.
Получайте удовольствие от игры в автоматы на сайте Cryptoboss Casino, и выигрывайте крупные суммы на реальные деньги.
Играйте на популярных слотах в Cryptoboss Casino, где выигрыши ждут каждого.
Играйте на деньги на своих любимых слотах, для азартных игроков.
На сайте Cryptoboss ждут увлекательные слоты, которые подарят вам удовольствие.
Почувствуйте волнение от игры в казино Cryptoboss на автоматах, для тех, кто мечтает о крупном выигрыше.
Играйте в казино Cryptoboss и выигрывайте крупные суммы, для тех, кто готов рисковать.
Играйте в лучшие игровые автоматы на сайте Cryptoboss, для тех, кто мечтает об успехе.
Играйте на деньги в лучших слотах на сайте Cryptoboss, для ценителей азарта.
Увлекательные слоты на сайте Cryptoboss ждут вас, для любителей азартных игр.
Играйте в казино Cryptoboss на лучших автоматах, которые порадуют вас выигрышами.
Играйте на деньги в казино Cryptoboss на лучших автоматах, где каждый может стать победителем.
Играйте на популярных слотах на сайте Cryptoboss Casino, для тех, кто ищет азарт.
Эмоции бурлят в крови, играя в казино Cryptoboss на автоматах, где каждый может испыт
cryptoboss casino автоматы [url=https://zasport.su/]cryptoboss casino игровые автоматы cryptoboss ru casino[/url] .
farmacia online senza ricetta [url=https://farmaciait.men/#]Farmacie on line spedizione gratuita[/url] farmacia online piГ№ conveniente
http://sildenafilit.pro/# viagra prezzo farmacia 2023
farmacie online autorizzate elenco
Самые свежие данные о курсе валют в Казахстане
Где проверить курс валют в Казахстане
Советы по обмену валют в Казахстане
Прогноз курса валют в Казахстане
Где выгодно обменять деньги в Казахстане
курс рубля к тенге на сегодня [url=https://kursy-valut-online.kz/]курс рубля на сегодня караганда[/url] .
Попробуйте свои силы в казино от Cryptoboss, станьте победителем вместе с лучшим криптовалютным казино, криптовалютные ставки для настоящих боссов, выиграйте криптовалюты в казино от Cryptoboss, Cryptoboss casino – ваш путь к успеху, захватывающий азарт с криптовалютным боссом, будьте боссом в мире криптовалютных игр с Cryptoboss casino, эксклюзивное казино для ценителей криптовалют, взломай банк с Cryptoboss casino, играйте и выигрывайте с лучшим криптовалютным казино, достижения и успехи вместе с Cryptoboss casino, Cryptoboss casino – ваш путеводитель в мире криптовалютных игр, получите криптовалютные призы в Cryptoboss casino, Cryptoboss casino – выбор тех, кто ценит качество, Cryptoboss casino – ваше казино удачи, наслаждайтесь азартом с Cryptoboss casino.
криптобосс [url=https://ikea-expert.ru/]cryptoboss cryptoboss casino2 xyz[/url] .
viagra generico sandoz [url=https://sildenafilit.pro/#]viagra generico[/url] viagra online spedizione gratuita
Смешные картинки http://prikoly-shutki.ru/kartinki-prikolnye Что такое мемы.
comprare farmaci online all’estero: Farmacie online sicure – farmacia online
farmacie online sicure: BRUFEN 600 bustine prezzo – п»їFarmacia online migliore
viagra originale in 24 ore contrassegno [url=https://sildenafilit.pro/#]viagra senza prescrizione[/url] farmacia senza ricetta recensioni
Увлекательное казино Cryptoboss ждет вас, станьте победителем вместе с лучшим криптовалютным казино, уникальный опыт в мире криптовалютного азарта, попробуйте удачу в казино Cryptoboss, выиграть криптовалюты легко в Cryptoboss casino, играйте на крипто-максимуме вместе с Cryptoboss, будьте боссом в мире криптовалютных игр с Cryptoboss casino, эксклюзивное казино для ценителей криптовалют, удивительные возможности в казино от Cryptoboss, особые привилегии для лучших игроков, революция в криптовалютных играх с Cryptoboss casino, Cryptoboss casino – ваш путеводитель в мире криптовалютных игр, получите криптовалютные призы в Cryptoboss casino, Cryptoboss casino – выбор тех, кто ценит качество, выигрывайте крупные суммы с Cryptoboss casino, присоединяйтесь к лидерам в мире криптовалютных игр с Cryptoboss casino.
cryptoboss вход [url=https://ikea-expert.ru/]криптобосс вход[/url] .
https://farmaciait.men/# farmacia online
п»їFarmacia online migliore
farmacia online piГ№ conveniente [url=http://tadalafilit.com/#]Cialis generico farmacia[/url] farmacie online sicure
Farmacie on line spedizione gratuita: Farmacia online migliore – Farmacie on line spedizione gratuita
Farmacie on line spedizione gratuita [url=https://farmaciait.men/#]Farmacie on line spedizione gratuita[/url] farmacia online
brand neurontin 100 mg canada: neurontin 1000 mg – neurontin 2400 mg
http://furosemide.men/# buy lasix online
neurontin 800 pill [url=https://gabapentin.site/#]neurontin canada[/url] neurontin 800
prednisone tablets: prednisone for sale online – prednisone 50 mg coupon
Официальный промокод мелбет при регистрации даёт возможность получить бонус на первый депозит в размере до 10400 рублей, либо фрибет 30EUR. Промокод проверен и актуален, работает только в офшорной версии бк Мелбет в 2024 году. Букмекерская контора Мелбет пользуется популярностью, славится щедростью, поскольку вознаграждает новых пользователей, впервые зарегистрировавших на портале, и постоянных беттеров. В большинстве случаев награды в виде промокодов – специальных комбинаций, требующих активации. Благодаря промокод для фриспины можно получить увеличенный бонус, главное – правильно использовать буквенно-цифровое сочетание. Бонус не является безвозмездным подарком от букмекера. Чтобы получить возможность вывода денежных средств, беттеру предстоит выполнить ряд условий. Что обеспечивает промокод в Мелбет, как активируют, доступные бонусы при регистрации на сегодня, условия и правила отыгрыша – подробно рассмотрим в обзоре.
Официальный сайт Cryptoboss Casino: победа в ваших руках
cryptoboss официальный [url=https://101optovik.ru/]cryptoboss casino официальный зеркало[/url] .
Как поднять настроение с помошью анекдота. ржачные анекдоты
https://allods.my.games/forum/index.php?page=User&userID=157454
prednisone for sale no prescription: prednisone 5 mg – purchase prednisone
автомобиль sollers atlant sollers официальный
Успешная регистрация на сайте cryptoboss casino – ваш шанс на крупный выигрыш, Легко и быстро зарегистрироваться на cryptoboss casino, Начните путь к большим выигрышам с регистрации на сайте cryptoboss casino, Присоединяйтесь к cryptoboss casino и станьте частью игрового сообщества, Регистрация на cryptoboss casino – ваш первый шаг к увлекательному миру азартных игр, Cryptoboss casino приглашает вас зарегистрироваться и насладиться игровым процессом, Регистрация на cryptoboss casino – ваш ключ к миру азартных развлечений, Успешная регистрация на cryptoboss casino – ваша возможность стать лидером в игровой индустрии, Cryptoboss casino готов принять вас – пройдите регистрацию и начните играть, Cryptoboss casino ждет вас – присоединяйтесь и начните играть, Станьте участником cryptoboss casino – зарегистрируйтесь и начните играть сегодня, Cryptoboss casino: регистрация – быстро, просто, надежно, Cryptoboss casino приглашает вас стать его участником – зарегистрируйтесь сейчас, Присоединяйтесь к cryptoboss casino и станьте обладателем эксклюзивных привилегий, Cryptoboss casino рад приветствовать новых игроков – присоединяйтесь сейчас, Регистрация на cryptoboss casino – ваш шанс на удачу.
криптобосс регистрация [url=https://auto-adventures.ru/]cryptoboss регистрация hds5[/url] .
buy ventolin over the counter: Buy Albuterol for nebulizer online – ventolin cream
buy rybelsus [url=https://rybelsus.tech/#]Buy semaglutide pills[/url] Buy semaglutide pills
Получите эксклюзивный cryptoboss casino промокод|Уникальный шанс с промокодом на cryptoboss casino
Бонусный код для cryptoboss casino|Получите дополнительные бонусы с cryptoboss casino промокодом
Эксклюзивная акция для игроков cryptoboss casino|Уникальное предложение от cryptoboss casino с промокодом
Увеличьте свои шансы на победу в cryptoboss casino промокодом|Бонус при регистрации в cryptoboss casino с промокодом
криптобосс промокод на дополнительные акции [url=https://namelessone.ru/]cryptoboss промокод hds5[/url] .
Играйте в cryptoboss casino с преимуществом промокода
Получите бонусный приз с cryptoboss casino промокодом
Играйте в cryptoboss casino с дополнительными бонусами от промокодов|Эксклюзивный cryptoboss casino промокод – ваш шанс на победу
cryptoboss casino – ваш ключ к успеху с промокодом|Получите дополнительные бонусы с cryptoboss casino промокодом|Бонусная программа cryptoboss casino с уникальным промокодом|Играйте с выгодой: cryptoboss casino промокод|Увеличьте свои шансы на победу с cryptoboss casino промокодом|Бонусы и привилегии с cryptoboss casino промокодом|Получите дополнительные бонусы с cryptoboss casino промокодом|cryptoboss casino промокод – ваш шанс на успех|cryptoboss casino – ваша удача по промокоду|Увеличьте свои шансы на победу с промокодами от cryptoboss casino|Действуйте прямо сейчас с cryptoboss casino промокодом|Используйте промокод в cryptoboss casino для больших выигрышей|Бонусы и скидки с cryptoboss casino промокодом|Играйте в cryptoboss casino с уникальными привилегиями по промокоду|Получите дополнительные бонусы в cryptoboss casino с промокодом|cryptoboss casino – ваш ключ к успеху с промокодами|Увеличьте свои шансы на победу в cryptoboss casino с промокодом|Получите дополнительные бонусы в crypt
https://ventolininhaler.pro/# ventolin online united states
can you buy ventolin over the counter uk: Buy Albuterol for nebulizer online – buy ventolin australia
terraria clocks bedside clocks
Кракен сайт – это онлайн-площадка, работающая в скрытых сетях интернета, где пользователи могут покупать и продавать различные виды наркотиков. Для доступа к Kraken onion необходимо использовать специальное программное обеспечение, позволяющее обходить блокировки и обеспечивающее анонимность пользователей.
prednisone online sale: prednisone 10 – cost of prednisone tablets
1xBet
1xBet offers free promo codes that provide users with bonuses without requiring a deposit. These codes are a great way to try out the platform and win real money without risking your own funds.
Сайт о биодобавках https://биодобавки.рф подробная информация о видах добавок, их действии и пользе. Рекомендации по выбору для поддержки здоровья на основе актуальных исследований.
buy neurontin online: neurontin price comparison – neurontin brand coupon
neurontin 300 mg price in india: order neurontin online – neurontin 300 mg pill
prednisone for sale: prednisone canada pharmacy – prednisone online
http://gabapentin.site/# neurontin 100
Сайт о биодобавках https://биодобавки.рф предлагает проверенную информацию о натуральных добавках для здоровья. Узнайте, как выбрать подходящие средства для улучшения иммунитета, повышения энергии и поддержания активного образа жизни. Подробные описания и советы помогут сделать осознанный выбор.
Как поднять настроение с помошью мемов. прикольные мемы
https://ujkh.ru/forum.php?PAGE_NAME=profile_view&UID=119865
buy ventolin online nz: buy Ventolin – ventolin nz
ventolin 500 mg: Buy Albuterol inhaler online – ventolin tablet 4mg
lasix 100 mg tablet: buy furosemide – furosemide
Букмекерская контора Melbet является одним из столпов международной беттинговой индустрии. За счет масштабной маркетинговой компании, высоких коэффициентов и оперативной технической поддержки БК Мелбет удалось привлечь и удержать большое количество игроков. На сегодняшний день, букмекер предлагает получить один из самых высоких бонусов на рынке – 10400 рублей. Размер бонуса в Melbet составляет 100% от суммы первого пополнения, но не менее 100 рублей и не более 10400. К примеру, если пополнить баланс на сумму 4000, то справа от основного счета появится бонусный. Как видим, использовать как получить бесплатный промокод в имеет смысл, особенно тем бетторам и бонусхантерам, которые привыкли заключать пари по-крупному. С учетом того, что он бесплатный – воспользоваться им может абсолютно любой игрок.
ventolin mexico: Buy Albuterol inhaler online – ventolin tablet medication
https://ventolininhaler.pro/# ventolin 4mg uk
Сайт предоставляет информацию о биодобавках http://биодобавки.рф состав, польза и рекомендации по применению. Здесь вы найдёте обзоры эффективных добавок для улучшения здоровья, иммунитета и энергии на основе научных данных и экспертных мнений.
Buy compounded semaglutide online: Rybelsus 7mg – Buy semaglutide pills
http://indiadrugs.pro/# Online medicine order
online canadian pharmacy: Pharmacies in Canada that ship to the US – canadian pharmacy antibiotics
purple pharmacy mexico price list: mexican pharma – reputable mexican pharmacies online
Получите эксклюзивный cryptoboss casino промокод|Новый промокод для cryptoboss casino
Играйте в cryptoboss casino с привлекательным промокодом|Увеличьте свой выигрыш с cryptoboss casino промокодом
Успейте воспользоваться привилегией cryptoboss casino промокода|Уникальное предложение от cryptoboss casino с промокодом
cryptoboss casino промокод – ваш ключ к выигрышу|cryptoboss casino – играйте со скидкой по промокоду
cryptoboss промокод hds5 [url=https://namelessone.ru/]криптобосс промокод[/url] .
Получите уникальный бонус с cryptoboss casino промокодом
Используйте cryptoboss casino промокод для увеличения выигрыша
Регулярные акции и промокоды для cryptoboss casino|Получите уникальное предложение с cryptoboss casino промокодами
cryptoboss casino – ваш ключ к успеху с промокодом|cryptoboss casino промокод – ваш путь к большим выигрышам|Специальное предложение для игроков cryptoboss casino: промокод|Играйте с выгодой: cryptoboss casino промокод|Играйте в cryptoboss casino с эксклюзивным промокодом для успеха|Успейте активировать промокод для увеличения выигрыша|Получите дополнительные бонусы с cryptoboss casino промокодом|cryptoboss casino промокод – ваш шанс на успех|Играйте в cryptoboss casino с преимуществом промокода|cryptoboss casino промокоды – ваш путь к успеху|Получите уникальные бонусы с cryptoboss casino промокодом|cryptoboss casino – ваш шанс на успех с промокодом|Уникальное предложение от cryptoboss casino с промокодом|Играйте в cryptoboss casino с уникальными привилегиями по промокоду|Используйте cryptoboss casino промокод для увеличения шансов на победу|Регулярные акции и cryptoboss casino промокоды для победы|Получите привилегии с cryptoboss casino промокодом|Играйте в cryptoboss casino с уникальным промокодом для успеха
Смешные анекдоты. История анекдотов.
online shopping pharmacy india [url=http://indiadrugs.pro/#]Online medication home delivery[/url] pharmacy website india
Сайт предоставляет информацию о биодобавках биодобавки.рф состав, польза и рекомендации по применению. Здесь вы найдёте обзоры эффективных добавок для улучшения здоровья, иммунитета и энергии на основе научных данных и экспертных мнений.
http://canadapharma.shop/# safe canadian pharmacy
safe canadian pharmacy: Pharmacies in Canada that ship to the US – best canadian pharmacy online
pharmacy website india: online Indian pharmacy – п»їlegitimate online pharmacies india
Great! Thank you so much for sharing this. I can’t wait to use it.
Great! Thank you so much for sharing this. I can’t wait to use it.
Свежие приколы
Как появились приколы. Узнайте, как поднять себе настроение!
medicine in mexico pharmacies [url=https://mexicanpharma.icu/#]medication from mexico[/url] mexican drugstore online
http://canadapharma.shop/# canada drug pharmacy
buying from online mexican pharmacy: pharmacies in mexico that ship to usa – reputable mexican pharmacies online
https://mexicanpharma.icu/# best online pharmacies in mexico
ed drugs online from canada: Canadian Pharmacy – canada pharmacy online
mexico pharmacies prescription drugs https://mexicanpharma.icu/# mexican online pharmacies prescription drugs
mexico pharmacies prescription drugs
medication from mexico pharmacy [url=https://mexicanpharma.icu/#]mexican pharmacy[/url] mexico drug stores pharmacies
Бесплатный промокод актуален как для букмекерской конторы Мелбет, так и для международной Melbet при регистрации в 2024 году. Официальный и рабочий промокод для новых клиентов БК дает повышенный бонус на первый депозит.В этих двух букмекерских конторах вводить промокод Мелбет надо именно во время регистрации. Он увеличивает стандартный бонус на первый депозит на 30%, и его легко можно вывести, выполнив некоторые условия букмекерской конторы Melbet. Мелбет – букмекерская контора, официально зарегистрированная в России в 2012 году. Она одна из первых стала предоставлять услуги болельщикам и любителям спорта. На данный момент контора предлагает широкое поле деятельности для прогнозистов и болельщиков, совершающих ставки. Кроме того, Мелбет дает обзор многочисленных событий из мира спорта и киберспорта, а также информацию о результатах матчей. Пользователи сервиса отмечают хорошие коэффициенты и щедрую программу бонусов. О последних нужно сказать отдельно: они доступны всем гостям сайта, даже новичкам. Выгодные предложения от букмекерской конторы позволяют делать ставки на различные спортивные события без вложения личных средств. В этой статье дан обзор промокод при регистрации melbet и варианты их использования.
Используйте промокод в cryptoboss casino и получите уникальные бонусы|Новый промокод для cryptoboss casino
Секретный промокод от cryptoboss casino|Используйте промокод в cryptoboss casino и увеличьте свои шансы на победу
Успейте воспользоваться привилегией cryptoboss casino промокода|Уникальное предложение от cryptoboss casino с промокодом
cryptoboss casino промокод – ваш ключ к выигрышу|Бонус при регистрации в cryptoboss casino с промокодом
криптобосс промокод на увеличение выигрыша [url=https://namelessone.ru/]криптобосс промокод на дополнительные акции[/url] .
Успех в cryptoboss casino с промокодом
Используйте cryptoboss casino промокод для увеличения выигрыша
Играйте в cryptoboss casino с дополнительными бонусами от промокодов|cryptoboss casino – преимущества промокодов
Играйте в cryptoboss casino с бонусным промокодом для победы|Получите дополнительные бонусы с cryptoboss casino промокодом|Специальное предложение для игроков cryptoboss casino: промокод|Играйте с выгодой: cryptoboss casino промокод|Играйте в cryptoboss casino с эксклюзивным промокодом для успеха|Бонусы и привилегии с cryptoboss casino промокодом|Играйте в cryptoboss casino с уникальным промокодом и выиграйте больше|Уникальное предложение для игроков cryptoboss casino: промокод|cryptoboss casino – ваша удача по промокоду|Увеличьте свои шансы на победу с промокодами от cryptoboss casino|Получите уникальные бонусы с cryptoboss casino промокодом|cryptoboss casino – ваш шанс на успех с промокодом|Играйте в cryptoboss casino с дополнительными бонусами по промокоду|cryptoboss casino – ваш путь к успеху с промокодом|cryptoboss casino – играйте с выгодой с промокодами|cryptoboss casino – ваш ключ к успеху с промокодами|Увеличьте свои шансы на победу в cryptoboss casino с промокодом|Эксклюзивный cryptoboss casino промокод – ваш путь к выигрышу
Смешные анекдоты. Что такое анекдот.
http://canadapharma.shop/# buy canadian drugs
Great! Thank you so much for sharing this. I can’t wait to use it.
reputable mexican pharmacies online [url=http://mexicanpharma.icu/#]medication from mexico[/url] purple pharmacy mexico price list
https://mexicanpharma.icu/# п»їbest mexican online pharmacies
Как развеселить друга с помощью забавных приколов
http://mexicanpharma.icu/# mexican border pharmacies shipping to usa
mexican rx online [url=http://mexicanpharma.icu/#]buying prescription drugs in mexico[/url] medicine in mexico pharmacies
buy prescription drugs from india: online Indian pharmacy – top online pharmacy india
Just what I was looking for, thankyou for putting up.
https://pharmaciepascher.pro/# pharmacie en ligne france fiable
Sweet Bonanza – Demo Mode Available for Free Want to try Sweet Bonanza risk-free? Play in demo mode to experience the gameplay, features, and fun without spending any real money.
[url=https://sweet-bonanza-game.ru/]slot bonanza[/url]
Pharmacie sans ordonnance: pharmacie en ligne pas cher – pharmacie en ligne avec ordonnance
выкуп лизинговых автомобилей https://vikup-avto2.ru
Viagra prix pharmacie paris [url=https://vgrsansordonnance.com/#]Meilleur Viagra sans ordonnance 24h[/url] Acheter viagra en ligne livraison 24h
Sweet Bonanza Autoplay Feature – Play Hands-Free! Discover the convenience of Sweet Bonanza’s autoplay feature. Set your bet, activate autoplay, and watch the reels spin while you sit back and relax!
[url=https://sweet-bonanza-game.ru/]slot bonanza[/url]
http://pharmaciepascher.pro/# pharmacie en ligne france livraison internationale
Прикольные анекдоты https://shutochki.wordpress.com/2024/09/27/smeshnye-anekdoty/
Indian porn https://desiporn.one in Hindi. Only high-quality porn videos, convenient search and regular updates.
Viagra vente libre pays: Viagra sans ordonnance 24h – п»їViagra sans ordonnance 24h
Viagra homme sans prescription: viagra sans ordonnance – Viagra pas cher paris
Porn videos https://thetittyfuck.com watch online for free. A selection of high-quality porn videos, a collection of sex videos
SildГ©nafil Teva 100 mg acheter [url=https://vgrsansordonnance.com/#]viagra sans ordonnance[/url] Viagra gГ©nГ©rique sans ordonnance en pharmacie
pharmacie en ligne: pharmacie en ligne sans ordonnance – pharmacie en ligne livraison europe
1xBet Code Promo Bonus https://actuchomage.org/includes/wkl/code_promo_69.html
The 1xBet code promo bonus is a code that unlocks bonuses like deposit matches, free bets, or free spins. These codes are often provided as part of welcome offers or special promotions and can be used to enhance the betting experience.
Как поднять настроение с помощью смешных шуток
https://vgrsansordonnance.com/# Viagra homme sans prescription
Pharmacie Internationale en ligne: Medicaments en ligne livres en 24h – vente de mГ©dicament en ligne
Sweet Bonanza Jackpot – How Big Can You Win? Wondering how much you can win in Sweet Bonanza? Check out the maximum payout potential and find out how players are hitting the jackpot with huge multiplier bonuses.
[url=https://sweet-bonanza-game.ru/]slot bonanza[/url]
Viagra en france livraison rapide: viagra sans ordonnance – Viagra vente libre pays
Big Wins in Sweet Bonanza – Success Stories Hear real success stories from players who hit big in Sweet Bonanza. Learn how they triggered huge multipliers and free spins to take home massive rewards!
[url=https://sweet-bonanza-game.ru/]slot bonanza[/url]
продвижение на валберис https://prodvizhenie-wildberries.ru
Viagra homme sans prescription: Viagra en france livraison rapide – Viagra sans ordonnance pharmacie France
Лучшие еврейские анекдоты
Заходи посмеяться
Федерация – это проводник в мир покупки запрещенных товаров, можно купить гашиш, купить мефедрон, купить кокаин, купить меф, купить экстази, купить альфа пвп, купить гаш в различных городах. Москва, Санкт-Петербург, Краснодар, Владивосток, Красноярск, Норильск, Екатеринбург, Мск, СПБ, Хабаровск, Новосибирск, Казань и еще 100+ городов.
pharmacie en ligne france livraison internationale [url=https://clssansordonnance.icu/#]cialis prix[/url] Pharmacie Internationale en ligne
semaglutide tablets [url=https://rybelsus.shop/#]buy semaglutide online[/url] rybelsus price
Ozempic without insurance: ozempic online – buy ozempic
buy rybelsus online: semaglutide cost – cheapest rybelsus pills
http://ozempic.art/# ozempic coupon
rybelsus cost [url=http://rybelsus.shop/#]semaglutide cost[/url] buy semaglutide pills
Sweet Bonanza – Demo Mode Available for Free Want to try Sweet Bonanza risk-free? Play in demo mode to experience the gameplay, features, and fun without spending any real money.
[url=https://sweet-bonanza-game.ru/]slot bonanza[/url]
buy ozempic pills online: ozempic – ozempic coupon
http://ozempic.art/# ozempic
ozempic online [url=https://ozempic.art/#]ozempic[/url] ozempic generic
http://ozempic.art/# Ozempic without insurance
Смешные прикольные картинки для поднятия настроения
https://ozempic.art/# ozempic coupon
ozempic: ozempic coupon – ozempic online
ozempic coupon: buy ozempic pills online – ozempic coupon
semaglutide online [url=https://rybelsus.shop/#]rybelsus price[/url] semaglutide cost
ozempic online: ozempic cost – ozempic cost
buy ozempic pills online: ozempic generic – buy ozempic
Sweet Bonanza Autoplay Feature – Play Hands-Free! Discover the convenience of Sweet Bonanza’s autoplay feature. Set your bet, activate autoplay, and watch the reels spin while you sit back and relax!
[url=https://sweet-bonanza-game.ru/]slot bonanza[/url]
Ozempic without insurance [url=https://ozempic.art/#]buy cheap ozempic[/url] buy ozempic pills online
cheapest rybelsus pills: semaglutide cost – rybelsus cost
http://rybelsus.shop/# buy semaglutide online
ozempic generic [url=https://ozempic.art/#]ozempic online[/url] ozempic generic
ozempic cost: ozempic – ozempic coupon
buy ozempic pills online: ozempic coupon – Ozempic without insurance
http://ozempic.art/# Ozempic without insurance
rybelsus cost: rybelsus price – buy semaglutide pills
rybelsus cost [url=http://rybelsus.shop/#]buy rybelsus online[/url] semaglutide online
buy semaglutide online: buy semaglutide pills – semaglutide cost
bonus bet codes: A code that provides a free bet on a betting platform, allowing users to place a wager without risking their own money.
rybelsus cost: semaglutide online – rybelsus price
https://rybelsus.shop/# rybelsus pill
ozempic online: ozempic generic – ozempic coupon
rybelsus pill [url=https://rybelsus.shop/#]buy semaglutide online[/url] rybelsus cost
Смешные свежие анекдоты и шутки
Подними себе настроение
https://rybelsus.shop/# buy rybelsus online
rybelsus coupon: buy rybelsus online – semaglutide tablets
semaglutide cost [url=https://rybelsus.shop/#]buy semaglutide pills[/url] rybelsus coupon
buy semaglutide pills: rybelsus pill – semaglutide cost
ozempic coupon: buy ozempic – ozempic online
semaglutide cost [url=https://rybelsus.shop/#]rybelsus coupon[/url] semaglutide cost
https://ozempic.art/# buy ozempic pills online
ozempic cost: ozempic – ozempic cost
http://ozempic.art/# ozempic online
Ozempic without insurance [url=https://ozempic.art/#]buy ozempic pills online[/url] ozempic online
ozempic cost: ozempic generic – buy ozempic pills online
ozempic generic: ozempic generic – Ozempic without insurance
ремонт продажа автостекол в спб замена стекла цена
http://rybelsus.shop/# rybelsus cost
buy semaglutide online: rybelsus pill – semaglutide tablets
cheapest rybelsus pills [url=https://rybelsus.shop/#]rybelsus cost[/url] buy semaglutide online
https://rybelsus.shop/# buy rybelsus online
https://ozempic.art/# Ozempic without insurance
https://ozempic.art/# buy ozempic
ozempic cost: Ozempic without insurance – ozempic cost
buy rybelsus online: buy rybelsus online – buy semaglutide pills
ozempic cost [url=http://ozempic.art/#]buy ozempic pills online[/url] ozempic
gates of olympus автомат игра gates of olympus
rybelsus cost: buy rybelsus online – rybelsus cost
мостбет промокод 2024 промокод мостбет при регистрации рабочий 2024
ozempic generic [url=http://ozempic.art/#]buy cheap ozempic[/url] buy ozempic pills online
cheapest rybelsus pills: semaglutide online – rybelsus cost
https://rybelsus.shop/# buy semaglutide pills
https://rybelsus.shop/# buy semaglutide pills
ozempic [url=http://ozempic.art/#]buy ozempic[/url] ozempic cost
semaglutide tablets: rybelsus price – rybelsus pill
Online casino https://svoiak.ru/2024/10/06/1win-nigeria-the-best-betting-options-in-nigeria with high bonuses, roulette and slots, instant payouts. Register on the official mirror.
https://ozempic.art/# ozempic online
buy cheap ozempic [url=https://ozempic.art/#]ozempic[/url] Ozempic without insurance
ozempic online: ozempic coupon – ozempic cost
ozempic generic: ozempic coupon – ozempic coupon
http://ozempic.art/# Ozempic without insurance
semaglutide tablets [url=http://rybelsus.shop/#]rybelsus pill[/url] rybelsus pill
лаки джет официальный сайт lucky jet на деньги
Как улучшить настроение другу? Посмотрите
смешные анекдоты и поделитесь с близкими.
https://rybelsus.shop/# buy semaglutide pills
buy ozempic [url=https://ozempic.art/#]Ozempic without insurance[/url] Ozempic without insurance
https://rybelsus.shop/# semaglutide tablets
https://ozempic.art/# Ozempic without insurance
ozempic online [url=http://ozempic.art/#]ozempic generic[/url] ozempic online
+ Не можете построить долгие отношения, проще
без них, партнёры всё время не те
+ В конфликте с родителями, общение холодное или его
нет вовсе
+ В конфликте с родителями, общение холодное или его нет вовсе
+ Чувствуете, что страсть и любовь ушли из отношений
+ Достигли дна — долги, проблемы в отношениях, зависимости
+ Много делаете и стараетесь, но результаты уже не приходят
так, как раньше
+ Испытываете эмоциональное и/или
физическое выгорание
+ Испытываете эмоциональное и/или физическое выгорание
+ Не можете построить долгие отношения,
проще без них, партнёры всё время не те
+ Больше не испытываете эмоций
+ Достигли дна — долги, проблемы
в отношениях, зависимости
+ Одиноки, нет друзей и сложно строить отношения с людьми
+ Тащите всё на себе, нет времени на жизнь
+ В конфликте с родителями, общение холодное или его нет вовсе
+ Чувствуете, что страсть
и любовь ушли из отношений
https://t.me/s/psyholog_online_just_now
buy semaglutide online [url=http://rybelsus.shop/#]rybelsus cost[/url] cheapest rybelsus pills
ozempic coupon: ozempic coupon – ozempic generic
Прикольные мемы. Как они появились.
1xBet Promo Code Bonus https://idematapp.com/wp-content/pages/1xbet_promo_codes_free_bonus_offers.html
1xBet promo codes can unlock various bonuses, including deposit matches, free bets, and free spins. These codes are a great way to boost your bankroll and increase your chances of winning.
https://rybelsus.shop/# semaglutide cost
buy cheap ozempic: ozempic online – ozempic
http://ozempic.art/# buy cheap ozempic
Авиатор игра Авиатор на деньги
https://ozempic.art/# buy ozempic pills online
rybelsus pill [url=https://rybelsus.shop/#]rybelsus cost[/url] buy rybelsus online
http://rybelsus.shop/# rybelsus price
helium balloons with delivery buy helium balloons
cheapest rybelsus pills [url=https://rybelsus.shop/#]semaglutide online[/url] semaglutide tablets
pin-up bonanza [url=http://pinupturkey.pro/#]pin up giris[/url] pin-up casino
pin up giris: pin up casino – pin-up bonanza
pin up: pin up kz – пин ап казино
http://pinupkz.tech/# пинап кз
пинап кз: pin up kz – pin up kz
pin up giris: pin up aviator – pin up casino giris
pin up [url=http://pinupturkey.pro/#]pin up[/url] pin up giris
pin up bet [url=http://pinupturkey.pro/#]pin up[/url] pin up casino guncel giris
пин ап https://pinupru.site/# пин ап официальный сайт
pin up казино
pin up azerbaijan: pin up 306 – pin up azerbaijan
пин ап казино вход http://pinupkz.tech/# пин ап казино вход
pin up kz
пин ап вход [url=https://pinupru.site/#]пин ап вход[/url] пин ап зеркало
пин ап вход: пинап казино – пин ап казино вход
пинап казино: пин ап – пин ап казахстан
Casino and slot https://globalitsystem.us/2024/10/06/why-1win-benin-is-the-best-choice-for-you machines online. Play slot machines with bonus, casino for money. Registration and login to the working mirror
Казино Cryptoboss – Играй на крипту через актуальное зеркало https://by-it.ru/
Free online https://thetranny.com porn videos and movies. Only girls with dicks. On our site there are trans girls for every taste!
Смешные картинки.
pin up giris: pin up bet – pin up
pin up kz https://pinupturkey.pro/# pin-up casino
пин ап 634
pinup azerbaycan: pin-up oyunu – pinup az
пин ап казино зеркало [url=https://pinupru.site/#]пинап казино[/url] пин ап
pin up: pin up azerbaijan – pin up casino
pin up: пинап кз – пин ап казахстан
pin-up bonanza [url=http://pinupturkey.pro/#]pin up casino[/url] pin up bet
пин ап казино онлайн http://pinupkz.tech/# пинап казино
пин ап
http://pinupaz.bid/# pin-up oyunu
Porn video https://zeenite.com watch online from pages for free in FullHD quality. Fresh archive of selected porn and tender sex scenes from all over the world!
пин ап официальный сайт: пин ап казино зеркало – пин ап официальный сайт
пинап казино https://pinupaz.bid/# pinup azerbaycan
пин ап кз
пин ап: pin up – пин ап официальный сайт
pin up kz https://pinupaz.bid/# pin-up casino giris
pin up kz
пин ап 634 http://pinupru.site/# pin up казино
пин ап казино вход
Казино Криптобосс: быстрый вход через зеркало криптобосс официальный сайт
https://pinupturkey.pro/# pin-up casino giris
pin-up oyunu [url=https://pinupaz.bid/#]pin up[/url] pin up az
https://pinupaz.bid/# pinup azerbaycan
pin up casino: pin up casino guncel giris – pin up aviator
pin up giris [url=http://pinupturkey.pro/#]pin up[/url] pin up aviator
пин ап казино https://pinupturkey.pro/# pin-up casino
пинап кз
Смешные пошлые анекдоты.
pin up казино http://pinupaz.bid/# pin up
пин ап казино онлайн
Вызов сантехника https://santekhnik-moskva.blogspot.com/p/v-moskve.html на дом в Москве и Московской области в удобное для вас время. Сантехнические работы любой сложности, от ремонта унитаза, устранение засора, до замены труб.
pin up azerbaijan [url=https://pinupaz.bid/#]pin-up casino giris[/url] pin up az
pin up kz: pin up kz – pin up казино
http://pinupru.site/# пин ап
pin up casino [url=https://pinupaz.bid/#]pin up azerbaijan[/url] pin up azerbaijan
пин ап казахстан http://pinupkz.tech/# пин ап 634
pin up казино
https://pinupkz.tech/# пинап кз
пин ап 634 https://pinupru.site/# пин ап казино вход
пин ап 634
пинап кз: пин ап – пинап кз
Смешные видео приколы.
пин ап казино вход [url=https://pinupkz.tech/#]пинап казино[/url] пин ап кз
пин ап официальный сайт: пин ап казино зеркало – пин ап казино
pin-up kazino [url=https://pinupaz.bid/#]pin up azerbaijan[/url] pin up
пин ап кз http://pinupaz.bid/# pinup az
пинап кз
bs02.at
Semaglutide pharmacy price: rybelsus generic – rybelsus cost
http://stromectol.agency/# stromectol lotion
minocycline 100 [url=https://stromectol.agency/#]cheapest stromectol[/url] ivermectin pills canada
ivermectin iv: buy stromectol online – ivermectin cost australia
buy zithromax 1000 mg online [url=https://zithromax.company/#]buy zithromax z-pak online[/url] cost of generic zithromax
https://zithromax.company/# can you buy zithromax over the counter in mexico
http://zithromax.company/# zithromax 500 mg lowest price pharmacy online
generic neurontin pill: buy gabapentin – 32 neurontin
http://zithromax.company/# zithromax for sale us
Свежие приколы https://teletype.in/@anekdoty/prikoly-nastroenie.
neurontin 100 mg tablets [url=http://gabapentin.auction/#]gabapentin best price[/url] over the counter neurontin
cheap Rybelsus 14 mg: semaglutide – order Rybelsus for weight loss
neurontin price uk [url=http://gabapentin.auction/#]gabapentin best price[/url] prescription medication neurontin
http://gabapentin.auction/# neurontin 3
average cost of generic zithromax
https://stromectol.agency/# stromectol price uk
Buy semaglutide pills: order Rybelsus for weight loss – buy semaglutide online
https://gabapentin.auction/# neurontin discount
generic zithromax azithromycin
https://amoxil.llc/# order amoxicillin online no prescription
http://stromectol.agency/# ivermectin ireland
neurontin 400 mg tablets [url=https://gabapentin.auction/#]neurontin 3[/url] neurontin price
Way cool! Some very valid points! I appreciate you penning this
write-up and also the rest of the website is really good.
https://zithromax.company/# where can i get zithromax
ivermectin 9mg [url=http://stromectol.agency/#]stromectol price[/url] minocycline acne
stromectol tablets: stromectol price – stromectol order
https://semaglutide.win/# Rybelsus 7mg
buy cheap generic zithromax
cheap Rybelsus 14 mg: order Rybelsus for weight loss – Semaglutide pharmacy price
https://zithromax.company/# zithromax cost australia
https://stromectol.agency/# ivermectin 1% cream generic
zithromax 250 price
https://semaglutide.win/# Buy compounded semaglutide online
ivermectin eye drops [url=http://stromectol.agency/#]stromectol price[/url] minocycline uses
rybelsus cost [url=http://semaglutide.win/#]Buy semaglutide pills[/url] semaglutide
Веселые анекдоты про евреев https://sites.google.com/view/shutki-anekdoty/%D0%B0%D0%BD%D0%B5%D0%BA%D0%B4%D0%BE%D1%82%D1%8B-%D0%BF%D1%80%D0%BE-%D0%B5%D0%B2%D1%80%D0%B5%D0%B5%D0%B2.
amoxicillin 500 mg tablet price: cheapest amoxil – generic amoxicillin over the counter
https://zithromax.company/# cost of generic zithromax
zithromax tablets for sale
http://gabapentin.auction/# neurontin 2018
https://gabapentin.auction/# medicine neurontin
http://amoxil.llc/# amoxicillin 500 mg brand name
zithromax 500 mg for sale: order zithromax – how to get zithromax over the counter
https://stromectol.agency/# stromectol online pharmacy
zithromax 500mg price in india
Смешные прикольные картинки https://prikoly-tut.blogspot.com/2024/10/smeshnye-kartinki.html.
purchase zithromax z-pak [url=https://zithromax.company/#]zithromax for sale[/url] zithromax buy
cost of ivermectin cream [url=https://stromectol.agency/#]cheapest stromectol[/url] ivermectin 50ml
https://gabapentin.auction/# canada neurontin 100mg lowest price
zithromax tablets for sale
neurontin coupon: cheapest gabapentin – neurontin 200 mg capsules
https://semaglutide.win/# buy rybelsus
Buy compounded semaglutide online: Buy semaglutide pills – rybelsus price
http://stromectol.agency/# ivermectin coronavirus
https://amoxil.llc/# where to buy amoxicillin over the counter
zithromax 600 mg tablets
https://amoxil.llc/# amoxicillin no prescription
ivermectin gel [url=https://stromectol.agency/#]buy stromectol online[/url] cost of ivermectin
cheap Rybelsus 14 mg [url=https://semaglutide.win/#]Semaglutide pharmacy price[/url] Rybelsus 14 mg price
https://amoxil.llc/# medicine amoxicillin 500mg
http://gabapentin.auction/# neurontin 800 pill
buy zithromax without prescription online
Great write-up, I’m normal visitor of one’s site, maintain up the excellent operate, and It’s going to be a regular visitor for a lengthy time.
neurontin 600mg: gabapentin price – neurontin 800 mg tablets
neurontin 300: neurontin price australia – neurontin 300 mg
http://semaglutide.win/# Rybelsus 14 mg price
buy zithromax canada
where can you get amoxicillin [url=https://amoxil.llc/#]cheapest amoxil[/url] generic amoxicillin online
http://amoxil.llc/# cost of amoxicillin 30 capsules
Buy compounded semaglutide online [url=http://semaglutide.win/#]cheap Rybelsus 14 mg[/url] rybelsus generic
https://semaglutide.win/# semaglutide
Веселые приколы https://prikolnyekartinki.mystrikingly.com/blog/0ade1e0d9a9.
http://zithromax.company/# zithromax 500mg price
http://semaglutide.win/# rybelsus generic
generic zithromax over the counter
semaglutide: Rybelsus 7mg – semaglutide
cost for ivermectin 3mg: order stromectol – ivermectin cream 1
http://gabapentin.auction/# neurontin 800 pill
http://stromectol.agency/# minocycline 100 mg without prescription
where can you buy zithromax
neurontin 200 [url=https://gabapentin.auction/#]order gabapentin[/url] neurontin
Свежие анекдоты https://vk.com/vseshutochki.
neurontin mexico [url=http://gabapentin.auction/#]neurontin 100mg caps[/url] neurontin 500 mg
https://stromectol.agency/# ivermectin lice
zithromax 500 mg lowest price drugstore online
zithromax for sale us: zithromax prescription – buy zithromax without presc
buy zithromax online with mastercard: zithromax for sale – purchase zithromax online
azithromycin amoxicillin [url=https://amoxil.llc/#]amoxil best price[/url] can i purchase amoxicillin online
https://stromectol.agency/# stromectol tablets for humans
buy zithromax online with mastercard
zithromax prescription online [url=https://zithromax.company/#]zithromax for sale[/url] where can you buy zithromax
https://amoxil.llc/# can i buy amoxicillin online
how to buy zithromax online
generic zithromax 500mg: zithromax best price – zithromax price canada
buy minocycline 100mg for humans: buy stromectol online – ivermectin topical
zithromax 250 mg pill [url=https://zithromax.company/#]buy zithromax z-pak online[/url] zithromax for sale online
zithromax antibiotic without prescription [url=https://zithromax.company/#]generic zithromax[/url] zithromax without prescription
Gay Boys Porn https://gay0day.com HD is the best gay porn tube to watch high definition videos of horny gay boys jerking, sucking their mates and fucking on webcam
https://gabapentin.auction/# neurontin price in india
https://stromectol.agency/# ivermectin 10 mg
https://gabapentin.auction/# neurontin 400 mg tablets
zithromax 250 price
where can i buy oral ivermectin: minocycline 100mg tablets online – oral ivermectin cost
blacksprut
amoxacillian without a percription [url=http://amoxil.llc/#]cheapest amoxil[/url] amoxicillin without rx
Смешные приколы https://prikolyshutki.wordpress.com/2024/10/11/prikoly-umor/.
http://gabapentin.auction/# cheap neurontin
can you buy zithromax over the counter in canada
cheap Rybelsus 14 mg [url=https://semaglutide.win/#]rybelsus[/url] buy semaglutide online
http://zithromax.company/# zithromax cost
http://stromectol.agency/# ivermectin 3
zithromax capsules australia
zithromax for sale usa: buy zithromax z-pak online – zithromax prescription online
https://zithromax.company/# cheap zithromax pills
https://amoxil.llc/# amoxicillin without rx
ivermectin 4 tablets price [url=https://stromectol.agency/#]cheapest stromectol[/url] minocycline 50 mg for sale
http://zithromax.company/# can i buy zithromax online
zithromax order online uk
zithromax 1000 mg pills: buy zithromax z-pak online – zithromax 500mg price in india
ivermectin 3mg dose [url=https://stromectol.agency/#]stromectol uk buy[/url] ivermectin 0.5 lotion india
Смешные приколы https://teletype.in/@anekdoty/prikoly-nastroenie.
csgo gambling gambling sites
cs2 gambling csgo betting
top online pharmacy india: buy medicines online in india – mail order pharmacy india
mexico pharmacies prescription drugs [url=http://mexicanpharm24.pro/#]buying prescription drugs in mexico[/url] mexico drug stores pharmacies
buy prescription drugs without doctor https://mexicanpharm24.pro/# reputable mexican pharmacies online
india online pharmacy: pharmacy website india – indian pharmacy paypal
buying prescription drugs in mexico online [url=http://mexicanpharm24.pro/#]п»їbest mexican online pharmacies[/url] buying from online mexican pharmacy
Веселые приколы, шутки и картинки http://anekdotshutka.ru.
world pharmacy india: indian pharmacy paypal – reputable indian pharmacies
ed meds online pharmacy: ed medicine online – non prescription ed drugs
over the counter erectile dysfunction pills http://mexicanpharm24.pro/# mexican online pharmacies prescription drugs
http://drugs24.pro/# the best ed pills
reputable indian online pharmacy
https://indianpharmdelivery.com/# world pharmacy india
indian pharmacy online
mexican rx online: buying prescription drugs in mexico online – mexican border pharmacies shipping to usa
online pharmacy india [url=https://indianpharmdelivery.com/#]cheapest online pharmacy india[/url] reputable indian online pharmacy
impotance http://drugs24.pro/# best ed pills non prescription
mexican pharmaceuticals online [url=https://mexicanpharm24.pro/#]mexican mail order pharmacies[/url] п»їbest mexican online pharmacies
viagra without a prescription: erectile dysfunction – is ed reversible
buying from online mexican pharmacy: buying prescription drugs in mexico – mexico drug stores pharmacies
pills for ed: drug medication – medications online
best canadian online pharmacy http://indianpharmdelivery.com/# buy prescription drugs from india
impotence pills: buy ed drugs online – doctors for erectile dysfunction
mexican pharmaceuticals online [url=http://mexicanpharm24.pro/#]mexican online pharmacies prescription drugs[/url] п»їbest mexican online pharmacies
indian pharmacy [url=http://indianpharmdelivery.com/#]mail order pharmacy india[/url] top 10 online pharmacy in india
https://indianpharmdelivery.com/# reputable indian online pharmacy
best india pharmacy
http://drugs24.pro/# drug medication
india online pharmacy
ed drugs online: vitality ed pills – erectile dysfunction remedies
cheapest online pharmacy india: indianpharmacy com – top online pharmacy india
п»їbest mexican online pharmacies: mexico drug stores pharmacies – mexican online pharmacies prescription drugs
pills erectile dysfunction [url=https://drugs24.pro/#]buy prescription drugs without doctor[/url] best treatment for ed
medications for ed https://indianpharmdelivery.com/# top 10 pharmacies in india
bs2best at
https://sudvgorode.ru/
indian pharmacy [url=http://indianpharmdelivery.com/#]india pharmacy mail order[/url] indian pharmacy paypal
ed for men: medicines for ed – prescription drugs without doctor approval
http://indianpharmdelivery.com/# indian pharmacy
reputable indian online pharmacy
https://indianpharmdelivery.com/# world pharmacy india
indian pharmacy
ed pills online pharmacy: ed medicine online – pet meds without vet prescription
Online medicine order [url=https://indianpharmdelivery.com/#]best india pharmacy[/url] top 10 online pharmacy in india
п»їbest mexican online pharmacies: mexico drug stores pharmacies – mexican online pharmacies prescription drugs
medication from mexico pharmacy [url=http://mexicanpharm24.pro/#]mexican online pharmacies prescription drugs[/url] medication from mexico pharmacy
do i have ed: natural treatments for ed – cheap ed medication
cs go betting csgo gambling
Веселые анекдоты https://teletype.in/@anekdoty/smeshnye-anekdoty.
indian pharmacy online: cheapest online pharmacy india – cheapest online pharmacy india
pills erectile dysfunction http://drugs24.pro/# ed treatment natural
mexico drug stores pharmacies [url=http://mexicanpharm24.pro/#]mexico drug stores pharmacies[/url] mexico drug stores pharmacies
п»їlegitimate online pharmacies india: indian pharmacies safe – online shopping pharmacy india
Смешные анекдоты https://prikolyshutki.wordpress.com/2024/10/16/smeshnye-anekdoty/.
https://mexicanpharm24.pro/# best online pharmacies in mexico
world pharmacy india
mens erections [url=http://drugs24.pro/#]best pill for ed[/url] pharmacy medications
http://drugs24.pro/# ed drugs online from canada
indian pharmacy online
ed cures that actually work http://indianpharmdelivery.com/# world pharmacy india
online drugstore http://drugs24.pro/# cheap ed pills
online shopping pharmacy india [url=http://indianpharmdelivery.com/#]indian pharmacy paypal[/url] top 10 pharmacies in india
pharmacy website india [url=http://indianpharmdelivery.com/#]top 10 online pharmacy in india[/url] buy prescription drugs from india
Платформа для ставок 1win с множеством событий и азартных игр. Удобный интерфейс, моментальные выплаты и привлекательные бонусы делают ставки ещё увлекательнее. Откройте мир азарта и выигрышей с надежным сервисом и постоянными акциями для пользователей.
buy generic ed pills online http://drugs24.pro/# legal to buy prescription drugs without prescription
Поставка и настройка лазерных станков по России
Осуществляем поставку лазерных станков по всей России. Наши специалисты обеспечат быструю и профессиональную настройку оборудования на вашем предприятии.
лазерная резка купить [url=https://lazernye-stanki.ru/]лазерный станок для резки металла цена[/url] .
московский музей анимации официальный сайт московский музей анимации измайловское ш 73ж
московский музей анимации музей анимации в москве измайлово
http://drugs24.pro/# buy ed drugs
mail order pharmacy india
http://mexicanpharm24.pro/# buying prescription drugs in mexico online
indian pharmacy online
mexico drug stores pharmacies [url=https://mexicanpharm24.pro/#]mexican rx online[/url] mexico pharmacies prescription drugs
Комплексное техническое обслуживание лазерных станков
Наша компания предлагает комплексное техническое обслуживание лазерных станков.
резка нержавеющей стали [url=https://lazernye-stanki.ru/]станок с лазерной резкой металла[/url] .
indianpharmacy com [url=https://indianpharmdelivery.com/#]cheapest online pharmacy india[/url] indianpharmacy com
pump for ed https://drugs24.pro/# ed doctors
buy helium balloons with delivery helium balloon price
Платформа 1win предлагает широкий выбор спортивных событий, киберспорта и азартных игр. Пользователи получают высокие коэффициенты, быстрые выплаты и круглосуточную поддержку. Программа лояльности и бонусы делают игру выгоднее.
Веселые анекдоты http://anekdot-top.ru.
Поставка и настройка лазерных станков по России
Осуществляем поставку лазерных станков по всей России. Наши специалисты обеспечат быструю и профессиональную настройку оборудования на вашем предприятии.
лазерные станки по металлу [url=https://lazernye-stanki.ru/]резка металла лазером цена[/url] .
Лазерные станки для резки труб и листового металла
Наш ассортимент включает лазерные станки для резки труб и листового металла. Это идеальное решение для производства с высокой точностью и эффективностью.
лазерная резка чпу [url=https://lazernye-stanki.ru/]оптоволоконный лазерный станок[/url] .
where to buy balloons Dubai custom helium balloons with delivery Dubai
engineer manager resume correct resume of an engineer
http://rybelsus.icu/# Semaglutide pharmacy price
ed meds online without doctor prescription
Semaglutide pharmacy price: rybelsus price – Semaglutide pharmacy price
http://clopidogrel.pro/# antiplatelet drug
new erectile dysfunction treatment
rybelsus.icu: cheaper – order Rybelsus
cost of stromectol medication: stromectol shop – stromectol brand
plavix best price: clopidogrel – п»їplavix generic
http://stromectol1st.shop/# stromectol
india online pharmacy
https://rybelsus.icu/# order Rybelsus
herbal remedies for ed
buy Clopidogrel over the counter [url=https://clopidogrel.pro/#]generic pills[/url] buy clopidogrel online
Смешные приколы, шутки и картинки https://teletype.in/@anekdoty/prikoly-nastroenie.
more: good price – more
http://paxlovid1st.shop/# paxlovid pill
how to overcome ed naturally
Clopidogrel 75 MG price: best price on generic – buy clopidogrel bisulfate
generic plavix: cheap plavix antiplatelet drug – plavix best price
stromectol 0.5 mg: best price shop – minocycline 100mg tabs
http://clopidogrel.pro/# plavix best price
ed doctor
https://stromectol1st.shop/# stromectol 6 mg dosage
best online pharmacy india
https://rybelsus.icu/# more
ed vacuum pump
https://stromectol1st.shop/# stromectol tablet 3 mg
online pharmacy india
rybelsus cost: rybelsus generic – rybelsus price
ivermectin ebay: stromectol 1st shop – stromectol for head lice
more: rybelsus – good price
“Правильные перевозки” — это надежная транспортная компания, которая предоставляет услуги по перевозке грузов и вещей по всей России. Мы занимаемся транспортировкой мебели между городами и регионами страны. Благодаря профессиональному подходу и опыту наших специалистов, “транспортная компания правильные перевозки” гарантирует безопасность и сохранность вашего имущества на всех этапах транспортировки.
Для вашего удобства мы предлагаем услуги доставки мебели с возможностью рассчитать стоимость и сроки онлайн. Независимо от того, нужен ли вам домашний переезд или перевозка личных вещей, наша команда обеспечивает высокий уровень сервиса и индивидуальный подход к каждому клиенту. Уточнить детали или заказать услугу вы можете по телефону 8 (800) 505-18-39 или 88005051839.
Компания предлагает перевозку контейнеров с вещами, обеспечивая оперативную доставку в другой город. Наши специалисты профессионально занимаются квартирными переездами, минимизируя ваши затраты времени и средств. Обращайтесь к нам, и “транспортная компания правильные перевозки” сделает ваш переезд комфортным и безопасным.
Идеальное решение для перевозок | Оптимальное соотношение цены и качества | Надежность на каждом этапе перевозки | Превосходное качество транспортных услуг | Безукоризненная репутация в сфере грузоперевозок | Правильные решения в сфере транспортировки | Экономия времени и денег при заказе услуг | Клиентоориентированная компания при перевозках | Безопасность и надежность грузоперевозок | Правильные перевозки грузов без задержек | Эксперт в области транспортировки грузов | Идеальное решение для вашего бизнеса | Экономия времени и средств при перевозках | Лучший выбор для ваших перевозок
buy paxlovid online: check this – paxlovid for sale
http://rybelsus.icu/# rybelsus.icu
best medicine for ed
paxlovid price [url=https://paxlovid1st.shop/#]shop[/url] paxlovid price
paxlovid for sale: check this – paxlovid covid
https://stromectol1st.shop/# stromectol buy uk
indianpharmacy com
ivermectin oral solution: stromectol shop – ivermectin 400 mg brands
order Rybelsus: Semaglutide pharmacy price – order Rybelsus
rybelsus generic: Semaglutide pharmacy price – Buy semaglutide
https://clopidogrel.pro/# antiplatelet drug
ed medicine online
Смешные приколы, шутки и картинки http://shutki-anekdoty.ru/.
stromectol in canada [url=https://stromectol1st.shop/#]buy online[/url] buy minocycline 50 mg for humans
https://paxlovid1st.shop/# paxlovid cost without insurance
prescription drugs online without doctor
Produzione video professionale https://orbispro.it creazione di spot pubblicitari, film aziendali e contenuti video. Ciclo completo di lavoro, dall’idea al montaggio. Soluzioni creative per promuovere con successo il tuo brand.
buy semaglutide online: rybelsus cost – more
generic plavix [url=https://clopidogrel.pro/#]generic pills[/url] buy clopidogrel bisulfate
Свежие приколы, шутки и картинки http://shutki-anekdoty.ru/.
paxlovid cost without insurance: paxlovid shop – paxlovid generic
п»їpaxlovid: check this – buy paxlovid online
http://stromectol1st.shop/# ivermectin 0.5 lotion india
online pharmacy india
paxlovid generic [url=http://paxlovid1st.shop/#]paxlovid price[/url] paxlovid india
http://clopidogrel.pro/# generic plavix
natural cure for ed
buy plavix: plavix price – buy plavix
buy Clopidogrel over the counter: plavix price – plavix medication
semaglutide: buy rybelsus – rybelsus
http://clopidogrel.pro/# Plavix 75 mg price
cause of ed
ivermectin 6 mg tablets: stromectol 1st – ivermectin lotion for scabies
minocycline for sinus infection [url=https://stromectol1st.shop/#]stromectol 1st[/url] buy minocycline 100mg otc
buy semaglutide online: cheaper – rybelsus
http://stromectol1st.shop/# minocycline indications
п»їlegitimate online pharmacies india
buy Clopidogrel over the counter: best price on generic – buy plavix
Paxlovid over the counter [url=https://paxlovid1st.shop/#]paxlovid for sale[/url] buy paxlovid online
Buy semaglutide: buy rybelsus – rybelsus cost
https://rybelsus.icu/# order Rybelsus
cat antibiotics without pet prescription
minocycline for rosacea: cheapest stromectol – ivermectin 3 mg tablet dosage
paxlovid covid [url=http://paxlovid1st.shop/#]check this[/url] Paxlovid over the counter
buy clopidogrel bisulfate: best price on generic – plavix medication
http://rybelsus.icu/# good price
ed pills for sale
paxlovid pill: paxlovid buy – paxlovid for sale
paxlovid buy [url=http://paxlovid1st.shop/#]check this[/url] paxlovid india
plavix medication: generic pills – buy clopidogrel online
http://stromectol1st.shop/# buy minocycline 50mg online
pharmacy website india
Веселые анекдоты http://shutki-anekdoty.ru/anekdoty.
minocycline generic: best price shop – minocycline 50mg online
more [url=http://rybelsus.icu/#]rybelsus generic[/url] good price
Cost of Plavix without insurance: generic pills – Plavix 75 mg price
Paxlovid buy online: paxlovid shop – paxlovid generic
buy clopidogrel online: check clopidogrel pro – buy plavix
rybelsus: Semaglutide pharmacy price – cheaper
rybelsus.icu [url=http://rybelsus.icu/#]Buy semaglutide[/url] semaglutide
You should participate in a contest for among the best blogs on the web. I will suggest this web site!
order minocycline 100mg online: minocycline for acne – minocycline hydrochloride
http://stromectol1st.shop/# ivermectin 8000
buy prescription drugs from india
semaglutide: rybelsus – good price
Прикольные мемы http://shutki-anekdoty.ru/kartinki-prikolnye.
where to buy stromectol: best price shop – ivermectin 6mg tablet for lice
bc games
plavix medication: generic pills – Cost of Plavix without insurance
order Rybelsus [url=https://rybelsus.icu/#]rybelsus.icu[/url] more
more: rybelsus – rybelsus price
комиссия по соут https://sout095.ru
внеплановая оценка условий труда https://sout095.ru
Мы понимаем, что каждый клиент уникален, поэтому наш сервис направлен на индивидуальный подбор микрозаймов, максимально соответствующих вашим потребностям. Независимо от того, требуется ли вам срочный заем на небольшую сумму или долгосрочный микрозайм с гибкими условиями, мы поможем вам найти лучшее решение. Наша платформа удобна и проста в использовании, что позволяет быстро сравнить условия различных микрофинансовых организаций и выбрать наиболее выгодное предложение.
займы онлайн [url=https://microloans.kz/]займ онлайн Казахстан[/url] .
Прикольные видео http://shutki-anekdoty.ru/videos.
Наша команда специалистов готова оказать вам всю необходимую поддержку и помощь в выборе микрозайма. Мы всегда на связи и готовы ответить на любые вопросы, связанные с процессом кредитования.
займ онлайн [url=https://microloans.kz/]микрокредиты[/url] .
1хбет [url=https://1winrussia.online/#]1xbet зеркало[/url] 1xbet официальный сайт
Great! Thank you so much for sharing this. I can’t wait to use it.
casino oyunlar?: canl? casino siteleri – slot casino siteleri
pin-up casino giris [url=https://1winbrasil.win/#]pin up azerbaycan[/url] pin up azerbaycan
pin up 306: pin up casino – pinup az
1xbet зеркало: 1xbet зеркало – 1xbet скачать
pin up: pin-up casino giris – pin up azerbaycan
pinup az: pin-up – pin up
Прикольные шутки http://shutki-anekdoty.ru/korotkie-anekdoty.
Мы делаем акцент на прозрачности наших услуг и предоставляем полную информацию о всех доступных предложениях. Наши клиенты могут быть уверены, что получат исчерпывающие сведения о сроках, ставках и возможных комиссиях, что позволяет им принимать осознанные решения. Мы стремимся создать доверительные отношения с каждым клиентом и всегда готовы предоставить подробные консультации по любым вопросам, связанным с микрозаймами.
займ онлайн [url=https://microloans.kz/]микрокредиты[/url] .
Профессиональный сервисный центр по ремонту телефонов в Москве.
Мы предлагаем: мастерская по ремонту телефонов
Наши мастера оперативно устранят неисправности вашего устройства в сервисе или с выездом на дом!
Профессиональный сервисный центр по ремонту компьютерных видеокарт по Москве.
Мы предлагаем: ремонт видеокарт компьютера
Наши мастера оперативно устранят неисправности вашего устройства в сервисе или с выездом на дом!
Great! Thank you so much for sharing this. I can’t wait to use it.
1xbet скачать: 1xbet зеркало – 1хбет
cazino [url=https://1wintr.fun/#]casino siteleri[/url] canl? casino siteleri
pin up: pin up – pin up casino
http://1winbrasil.win/# pin up casino
пин ап казино
Теперь вы можете скачать БК на Android и начать выигрывать на любых спортивных событиях
1xbet официальный сайт: 1хставка – 1xbet зеркало
1xbet официальный сайт: 1xbet – 1хставка
pin up: pin-up casino giris – pin-up
pin up kz [url=https://1winindia.tech/#]пин ап казино[/url] пин ап казино
pin-up: pin up casino – pin up azerbaycan
Работая на рынке Казахстана, наша компания зарекомендовала себя как надежный партнер для тех, кто ищет доступные и выгодные условия микрокредитования. Мы сотрудничаем только с проверенными и надежными финансовыми организациями, что позволяет нам предлагать вам микрозаймы с минимальными процентными ставками, гибкими условиями погашения и быстрым одобрением. Наши специалисты постоянно отслеживают изменения на рынке, чтобы предоставить вам актуальные и выгодные предложения.
микрозайм [url=https://microloans.kz/]займы онлайн[/url] .
1xbet зеркало: 1xbet скачать – 1хставка
pin up casino: pin-up – pin up casino
Профессиональный сервисный центр по ремонту телефонов в Москве.
Мы предлагаем: где можно починить телефон
Наши мастера оперативно устранят неисправности вашего устройства в сервисе или с выездом на дом!
https://1wintr.fun/# casino sitesi
пин ап
https://1winindia.tech/# пин ап кз
пинап
canl? casino siteleri: dunyan?n en iyi casino siteleri – dunyan?n en iyi casino siteleri
pin up 306: pin up 306 – pin up azerbaycan
1xbet скачать: 1xbet официальный сайт – 1xbet
pin up casino: pin-up casino giris – pin up
pin-up casino giris [url=http://1winbrasil.win/#]pin up[/url] pin up azerbaycan
canl? casino siteleri: casino siteleri – canl? casino
Профессиональный сервисный центр по ремонту телефонов в Москве.
Мы предлагаем: мастерская по ремонту телефонов
Наши мастера оперативно устранят неисправности вашего устройства в сервисе или с выездом на дом!
Свежие приколы http://shutki-anekdoty.ru/.
Профессиональный сервисный центр по ремонту телефонов в Москве.
Мы предлагаем: починить телефон
Наши мастера оперативно устранят неисправности вашего устройства в сервисе или с выездом на дом!
где купить кокаин очень детское порно
pin-up: pin up casino – pinup az
Unlu Sahabet Casino’da yeni oyuncular icin devasa bonus odulune sahip olun
Sahabet Casino [url=https://t.me/sahabet1194/]Sahabet[/url] .
купить меф через оператора питере порно инцест
Свежие приколы http://shutki-anekdoty.ru/.
pin-up: pin up casino – pin-up
1хбет: 1xbet официальный сайт – 1хставка
https://1winrussia.online/# 1хбет
пин ап казино
пинап [url=http://1winindia.tech/#]пин ап[/url] пинап кз
canl? casino: canl? casino – canl? casino
пин ап: пин ап вход – пин ап зеркало
1xbet: 1xbet скачать – 1хставка
1хставка: 1хбет – 1xbet зеркало
пин ап зеркало: пин ап зеркало – пин ап зеркало
пин ап казино: pin up – pin up
Профессиональный сервисный центр по ремонту игровых консолей Sony Playstation, Xbox, PSP Vita с выездом на дом по Москве.
Мы предлагаем: надежный сервис ремонта игровых консолей
Наши мастера оперативно устранят неисправности вашего устройства в сервисе или с выездом на дом!
pin-up: pinup az – pin up 306
Профессиональный сервисный центр по ремонту телефонов в Москве.
Мы предлагаем: сервисный центр смартфонов
Наши мастера оперативно устранят неисправности вашего устройства в сервисе или с выездом на дом!
https://1winrussia.online/# 1xbet зеркало
пин ап кз
https://1winbrasil.win/# pin up casino
пинап казино
пин ап: пинап зеркало – пин ап зеркало
casino sitesi: casino oyunlar? – dunyan?n en iyi casino siteleri
пинап кз: пинап казино – пин ап
1xbet официальный сайт [url=https://1winrussia.online/#]1xbet зеркало[/url] 1xbet зеркало
cazino: h?zl? casino – casino oyunlar?
Профессиональный сервисный центр по ремонту телефонов в Москве.
Мы предлагаем: ремонт мобильных устройств
Наши мастера оперативно устранят неисправности вашего устройства в сервисе или с выездом на дом!
canl? casino siteleri: dunyan?n en iyi casino siteleri – casino sitesi
Профессиональный сервисный центр по ремонту компьютерных видеокарт по Москве.
Мы предлагаем: стоимость ремонта видеокарты
Наши мастера оперативно устранят неисправности вашего устройства в сервисе или с выездом на дом!
пин ап официальный сайт: пин ап – пин ап зеркало
http://1winbrasil.win/# pin-up casino giris
пин ап кз
https://1winindia.tech/# пин ап казино
пинап казино
пин ап зеркало: пинап зеркало – пин ап зеркало
реклама в лифте стоимость реклама в лифте цена
dunyan?n en iyi casino siteleri: casino siteleri – dunyan?n en iyi casino siteleri
1xbet скачать: 1xbet официальный сайт – 1xbet официальный сайт
pin-up [url=https://1winbrasil.win/#]pin up casino[/url] pin up azerbaycan
пин ап казино вход: пин ап казино вход – пинап казино
реклама в лифтах компании реклама в лифтах в москве
1xbet скачать: 1хбет – 1хставка
пин ап [url=https://1winci.icu/#]пин ап вход[/url] пинап зеркало
пин ап казино: пин ап – пин ап
Прикольные анекдоты http://shutki-anekdoty.ru/anekdoty.
pin up casino: pinup az – pin up casino
1xbet зеркало: 1хставка – 1xbet скачать
Смешные анекдоты http://shutki-anekdoty.ru/anekdoty.
http://1winci.icu/# пин ап вход
пинап казино
http://1winbrasil.win/# pin-up casino giris
пинап
h?zl? casino: casino sitesi – canl? casino siteleri
pin up casino: pin up – pin up
пин ап казино [url=http://1winindia.tech/#]пинап[/url] пинап
пин ап казино: pin up – пин ап
пин ап казино вход: пинап кз – пин ап казино вход
pin up 306 [url=https://1winbrasil.win/#]pin up azerbaycan[/url] pin up casino
пин ап зеркало: пин ап зеркало – пин ап официальный сайт
https://1winbrasil.win/# pin up azerbaycan
пинап
Свежие анекдоты http://shutki-anekdoty.ru/anekdoty.
https://1winrussia.online/# 1xbet официальный сайт
пинап
пинап казино: пин ап казино вход – pin up kz
pin up azerbaycan: pin up azerbaycan – pin up azerbaycan
пинап: пинап – пинап
Перейдите на официальный сайт 888Starz и начните выигрывать
1хбет: 1хставка – 1xbet
https://mexicanpharm1st.com/# buying from online mexican pharmacy
ed in men: ed treatment pills – ed and diabetes
buy prescription drugs from india: best online pharmacy india – top 10 pharmacies in india
reputable indian online pharmacy: indianpharmacy com – Online medicine order
medications for ed: treatment of ed – cheap online pharmacy
https://drugs1st.store/# male enhancement products
ed pills cheap: best natural cure for ed – best ed drugs
over the counter ed: ed for men – cheap pet meds without vet prescription
http://drugs1st.store/# male erection
buy medication online [url=http://drugs1st.store/#]male ed pills[/url] ed pills
erectile dysfunction pills [url=http://drugs1st.store/#]pet antibiotics without vet prescription[/url] ed meds online without doctor prescription
mexico drug stores pharmacies: purple pharmacy mexico price list – mexico drug stores pharmacies
reputable indian pharmacies: cheapest online pharmacy india – top online pharmacy india
pharmacies in mexico that ship to usa: mexican rx online – medication from mexico pharmacy
https://mexicanpharm1st.com/# buying prescription drugs in mexico online
pet meds without vet prescription: canadian pharmacy online – online ed pills
https://indianpharm1st.com/# Online medicine home delivery
[url=][/url]
Временная регистрация в Москве: Быстро и Легально!
Ищете, где оформить временную регистрацию в Москве?
Мы гарантируем быстрое и легальное оформление без очередей и лишних документов.
Ваше спокойствие – наша забота!
Минимум усилий • Максимум удобства • Полная легальность
Свяжитесь с нами прямо сейчас!
Временная регистрация в Москве
[url=][/url]
mexican rx online: mexican mail order pharmacies – mexican pharmaceuticals online
indian pharmacy: indian pharmacies safe – Online medicine order
best ed medicine: pet meds without vet prescription – viagra vs cialis bodybuilding
http://mexicanpharm1st.com/# mexico pharmacies prescription drugs
indian pharmacy: п»їlegitimate online pharmacies india – buy medicines online in india
indian pharmacies safe: reputable indian online pharmacy – indian pharmacies safe
п»їlegitimate online pharmacies india [url=https://indianpharm1st.com/#]best online pharmacy india[/url] reputable indian online pharmacy
pharmacy online [url=https://drugs1st.store/#]best treatment for ed[/url] cheap drugs
ed treatment pills: ed meds online canada – generic viagra without a doctor prescription
indian pharmacy online: best india pharmacy – pharmacy website india
natural cures for ed: ed pills comparison – drugs online
Мы занимаемся вывозом мусора газелями разной модификации от стандартных 6 м3 до больших 14 м3 есть также грузчики, работаем по Московской области. Преимущества вывоза мусора газелью в том, что она самая дешёвая услуга вывоза мусора.
Как организовать вывоз мусора газелью, с максимальной экономией времени.
Надежность газели при перевозке мусора, которая убеждает.
Основные типы мусора, которые можно вывозить газелью, с учетом ограничений.
Как сэкономить на вывозе мусора газелью, сотрудничая с профессионалами.
Секрет успешного вывоза мусора газелью, учитывая все нюансы.
вывоз строительного мусора газелью [url=https://vyvoz-musora-gazel-mo.ru/]вывоз мусора газелью[/url] .
http://indianpharm1st.com/# india pharmacy
natural pills for ed: ed treatment review – pills for erection
prescription drugs online without doctor: pharmacy online – homepage
http://indianpharm1st.com/# best online pharmacy india
best price for generic viagra on the internet: treating ed – buy prescription drugs online
do i have ed: ed pills otc – prices of viagra at walmart
ed drugs list [url=http://drugs1st.store/#]foods for ed[/url] buy ed drugs online
best price for generic viagra on the internet [url=https://drugs1st.store/#]buying pills online[/url] online ed pills
http://indianpharm1st.com/# Online medicine order
indian pharmacy: best online pharmacy india – indian pharmacy
[url=][/url]
Временная регистрация в Москве: Быстро и Легально!
Ищете, где оформить временную регистрацию в Москве? Мы гарантируем быстрое и легальное оформление без очередей и лишних документов. Ваше спокойствие – наша забота!
Минимум усилий • Максимум удобства • Полная легальность
Свяжитесь с нами прямо сейчас!
[url=https://мосрегистрация77.рф/].[/url]
[url=][/url]
reputable indian online pharmacy: mail order pharmacy india – best india pharmacy
causes for ed: ed remedies – dog antibiotics without vet prescription
http://indianpharm1st.com/# cheapest online pharmacy india
mexican border pharmacies shipping to usa: buying from online mexican pharmacy – mexican drugstore online
Попутный груз из Новосибирска — это удобное решение для тех, кто ищет экономные перевозки
cheap erectile dysfunction: cheap pet meds without vet prescription – causes of ed
https://indianpharm1st.com/# buy prescription drugs from india
mexican online pharmacies prescription drugs: mexican rx online – buying from online mexican pharmacy
top erection pills: male erectile dysfunction – buy prescription drugs from canada cheap
http://pinupzerkalo.fun/# pin up zerkalo
pinup bet and casino
https://sweetbonanzatr.pro/# sweet bonanza tr
sweetbonanzatrpro: sweetbonanzatr.pro – sweet bonanza nas?l oynan?r
http://pinupzerkalo.fun/# пин ап зеркало
pin up win
pin-up casino giris: pin-up – pin up azerbaycan
https://pinupzerkalo.fun/# Официальный Сайт
Профессиональный сервисный центр по ремонту Apple iPhone в Москве.
Мы предлагаем: ремонт айфона с выездом мастера в москве
Наши мастера оперативно устранят неисправности вашего устройства в сервисе или с выездом на дом!
вагончик бытовка металлическая купить строительство бытовок домов
Смешные картинки http://shutki-anekdoty.ru/kartinki-prikolnye.
http://pinup-az.bid/# pinup az
pin up win
https://pinupzerkalo.fun/# пинап казино
пин ап казино [url=http://biznes-fabrika.kz/#]пинап[/url] пинап казино
Пин Ап Казахстан [url=https://biznes-fabrika.kz/#]Пин Ап Казахстан[/url] Пин Ап Казахстан
Прикольные видеоролики http://shutki-anekdoty.ru/videos.
http://biznes-fabrika.kz/# пин ап кз
pin up zerkalo
pin up 306: pin-up casino giris – pin up azerbaycan
Нужен доступ к бонусам? Просто скачайте 888starz для android
1win mocambique
pinup az: pin-up – pin up azerbaycan
[url=][/url]
Временная регистрация в Москве: Быстро и Легально!
Ищете, где оформить временную регистрацию в Москве? Мы гарантируем быстрое и легальное оформление без очередей и лишних документов. Ваше спокойствие – наша забота!
Минимум усилий • Максимум удобства • Полная легальность
Свяжитесь с нами прямо сейчас!
[url=https://regm7921.ru/].[/url]
[url=][/url]
https://sweetbonanzatr.pro/# sweetbonanzatr.pro
pin up zerkalo
https://sweetbonanzatr.pro/# sweet bonanza
sweetbonanzatr.pro: sweet bonanza – sweet bonanza
http://biznes-fabrika.kz/# пин ап казино
pin up zerkalo
пин ап зеркало: пин ап казино – бонусы пин ап
pin up azerbaycan: pinup az – pin up
https://biznes-fabrika.kz/# пинап
Пин Ап Казахстан: Пин Ап Казино Официальный Сайт – Пин Ап Казино Официальный Сайт
пин ап казино онлайн [url=https://biznes-fabrika.kz/#]пин ап казино[/url] pin up kz
sweet bonanza oyna [url=http://sweetbonanzatr.pro/#]sweetbonanzatr.pro[/url] sweet bonanza
Пин Ап Казахстан: пин ап кз – пины
bc game app download
пин ап казино: пинап – пин ап казино онлайн
https://sweetbonanzatr.pro/# sweet bonanza oyna
pin up win
бонусы пин ап: пин ап вход – Пин Ап Казино Официальный Сайт в России
пин ап вход: пин ап – пин ап вход
sweet bonanza: sweetbonanzatrpro – sweetbonanzatr.pro
Пин Ап Казахстан: Пин Ап Казахстан – pin up kz
http://pinupzerkalo.fun/# pin up zerkalo
pin up win
https://pinupzerkalo.fun/# пинко
sweet bonanza: sweet bonanza nas?l oynan?r – sweet bonanza oyna
бонусы пин ап [url=http://pinupzerkalo.fun/#]пинап казино[/url] Официальный Сайт
sweetbonanzatrpro [url=http://sweetbonanzatr.pro/#]sweet bonanza oyna[/url] sweet bonanza nas?l oynan?r
pinup-az bid: pin up – pinup-az bid
https://biznes-fabrika.kz/# pin up kz
pinup bet and casino
pin up zerkalo: пинко – пинап казино
bc game download
пин ап вход: pin up zerkalo – пин ап вход
https://pinupzerkalo.fun/# пинко
pinup bet and casino
Свежие и смешные видео https://sites.google.com/view/smeshnye-video/%D0%B3%D0%BB%D0%B0%D0%B2%D0%BD%D0%B0%D1%8F-%D1%81%D1%82%D1%80%D0%B0%D0%BD%D0%B8%D1%86%D0%B0.
sweet bonanza: sweet bonanza – sweet bonanza tr
sweet bonanza nas?l oynan?r: sweet bonanza – sweetbonanzatr.pro
http://pinup-az.bid/# pin-up casino giris
pin up zerkalo
http://pinup-az.bid/# pin up
sweet bonanza tr: sweet bonanza – sweet bonanza
пин ап вход [url=http://pinupzerkalo.fun/#]пин ап казино[/url] Официальный Сайт
pin-up casino giris [url=https://pinup-az.bid/#]pin-up[/url] pinup-az bid
http://pinup-az.bid/# pinup az
pin up zerkalo
pinup az: pinup az – pin up 306
pinup az: pin up – pin up
бонусы пин ап: пин ап вход – пин ап вход
https://pinupzerkalo.fun/# пин ап казино
http://biznes-fabrika.kz/# пин ап кз
pin up zerkalo
sweetbonanzatr.pro: sweet bonanza oyna – sweet bonanza
пин ап 634: пин ап кз – пинап
pinup-az bid: pin up – pin up azerbaycan
http://sweetbonanzatr.pro/# sweetbonanzatrpro
pin up casino
Пин Ап Казахстан: Пин Ап Казино Официальный Сайт – пины
Для эффективного продвижения важно освоить курс по накрутке ПФ и улучшить показатели.
https://pinupzerkalo.fun/# пинап казино
Пин Ап Казино Официальный Сайт: Пин Ап Казахстан – пинап
пинко [url=http://pinupzerkalo.fun/#]пинко[/url] бонусы пин ап
pin-up [url=http://pinup-az.bid/#]pin up[/url] pinup az
pinup-az bid: pinup – pinup-az bid
Смешные видео https://sites.google.com/view/smeshnye-video/%D0%B3%D0%BB%D0%B0%D0%B2%D0%BD%D0%B0%D1%8F-%D1%81%D1%82%D1%80%D0%B0%D0%BD%D0%B8%D1%86%D0%B0.
Свежие приколы http://shutki-anekdoty.ru.
http://biznes-fabrika.kz/# пины
pin up zerkalo
sweet bonanza nas?l oynan?r: sweetbonanzatr.pro – sweetbonanzatr.pro
sweet bonanza: sweetbonanzatr.pro – sweetbonanzatr.pro
https://pinup-az.bid/# pinup az
pin up win
https://pinupzerkalo.fun/# Пин Ап Казино Официальный Сайт в России
sweet bonanza tr: sweet bonanza – sweet bonanza
Пин Ап Казино Официальный Сайт в России: pinco – пинко
Сервисный центр предлагает замена матрицы pentax q замена экрана pentax q
Explorez notre collection de
Couteau a steak
pour chaque occasion
Прикольные анекдоты https://sites.google.com/view/smeshnye-video/anekdoty
cheapest: stromectol best price – stromectol
https://amoxil1st.shop/# Compare Prices
involves multisystem: gabapentin best price – Neurontin online
Свежие анекдоты http://shutki-anekdoty.ru/anekdoty
https://paxlovid1st.store/# Pills Paxlovid
See risks: paxlovid1st – paxlovid store
amoxil price: shop – buy amoxil online
https://paxlovid1st.store/# paxlovid price
rybelsus price: Urgent Specialists – rybelsus price
compare the best prices: gabapentin best price – Care provides
cheap: top-rated pills – amoxil price
https://gabapentin1st.pro/# involves multisystem
Urgent Specialists: Specialists – Patient Portal
Compare Prices: top-rated pills – Compare Prices
https://stromectol1st.store/# good price
http://semaglutide.ink/# Patient Portal
gabapentin pro: compare the best prices – Care provides
https://paxlovid1st.store/# Visit store
gabapentin pro: gabapentin best price – buy gabapentin
seo магазин https://is-market.ru
good price: stromectol – find bets price
Visit store: paxlovid1st – paxlovid price
semaglutide: Urgent Specialists – semaglutide
Сервисный центр предлагает качественный ремонт телефонов vertu ремонт телефонов vertu на дому
stromectol online: cheapest – stromectol delivery usa
http://semaglutide.ink/# semaglutide
Patient Portal: Patient Portal – semaglutide online
раскрутка сайтов москва https://is-market.ru
semaglutide: Rybelsus – Urgent Specialists
https://gabapentin1st.pro/# same-day delivery
http://gabapentin1st.pro/# Neurontin online
semaglutide: Urgent Specialists – semaglutide online
Care provides: Care provides – buy gabapentin
Patient Portal: semaglutide – rybelsus price
Свежие и смешные анекдоты http://shutki-anekdoty.ru/anekdoty
Для маршрута грузоперевозки Новосибирск Болотное выберите наш сервис для комфортной доставки.
online canadian pharmacy http://indianpharm24.pro/# india online pharmacy
indian pharmacy online [url=http://indianpharm24.pro/#]indian pharm 24[/url] mail order pharmacy india
indianpharmacy com [url=http://indianpharm24.pro/#]Order medicine from India to USA[/url] world pharmacy india
buy medicines online in india: indian pharm 24 – world pharmacy india
mexican pharmaceuticals online [url=https://mexicanpharm24.cheap/#]mexico pharmacy[/url] mexican online pharmacies prescription drugs
http://indianpharm24.pro/# india pharmacy
sildenafil without a doctor’s prescription
mexican drugstore online: Mexican pharmacy ship US – mexican online pharmacies prescription drugs
mexican mail order pharmacies [url=http://mexicanpharm24.cheap/#]mexican pharm 24[/url] reputable mexican pharmacies online
meds online without doctor prescription http://indianpharm24.pro/# india online pharmacy
http://mexicanpharm24.cheap/# mexico drug stores pharmacies
best pill for ed
top 10 pharmacies in india [url=http://indianpharm24.pro/#]Indian pharmacy international shipping[/url] indian pharmacy paypal
canada ed drugs https://pharm24.pro/# ed therapy
over the counter ed medication: cheap pharmacy online – ed medicine online
purple pharmacy mexico price list [url=http://mexicanpharm24.cheap/#]Legit online Mexican pharmacy[/url] mexican online pharmacies prescription drugs
indian pharmacy: Order medicine from India to USA – Online medicine order
soma therapy ed: cheap pharmacy – ed pills
http://pharm24.pro/# ed meds online canada
viagra without doctor prescription
cheap medications online [url=https://pharm24.pro/#]cheap pharmacy online[/url] prescription drugs online without
Сайт смешных историй http://shutki-anekdoty.ru/istorii собрание лучших веселых усторий. Ежедневное обновление контента для вашего настроения. Легко находите и делитесь забавными моментами с друзьями.
online ed medications: cheap pharmacy online – buy prescription drugs from india
Смешные приколы на сайте https://subscribe.ru/author/31612079 Самые смешные приколы. делитесь с друзьями. Легко находите и делитесь забавными моментами с друзьями.
ed drugs list http://mexicanpharm24.cheap/# mexican drugstore online
natural ed treatment [url=https://pharm24.pro/#]cheap pharmacy[/url] is it illegal to buy prescription drugs online
http://indianpharm24.pro/# reputable indian pharmacies
erectile dysfunction treatment
supplements for ed http://mexicanpharm24.cheap/# mexico drug stores pharmacies
buy prescription drugs from india [url=http://indianpharm24.pro/#]Best Indian pharmacy[/url] indianpharmacy com
Сервисный центр предлагает поменть стекло ritmix rmd-1070 поменять дисплей ritmix rmd-1070
1win login
buy prescription drugs online without: cheap meds – ed treatments that really work
buying prescription drugs in mexico [url=http://mexicanpharm24.cheap/#]mexican drugs[/url] buying from online mexican pharmacy
https://pharm24.pro/# otc ed drugs
real viagra without a doctor prescription usa
top 10 online pharmacy in india: indian pharm 24 – reputable indian online pharmacy
mexican drugstore online: mexican drugs – mexican drugstore online
foods for ed https://pharm24.pro/# errectile dysfunction
do i have ed: cheap prescription drugs – buy ed drugs online
http://pharm24.pro/# buy drug online
ed medications comparison
buy generic ed pills online [url=http://pharm24.pro/#]cheap pharmacy[/url] best drugs for erectile dysfunction
cheapest online pharmacy india [url=http://indianpharm24.pro/#]medicines from India[/url] Online medicine order
pills for erection https://indianpharm24.pro/# pharmacy website india
indian pharmacy [url=https://indianpharm24.pro/#]indian pharmacy purchase online[/url] Online medicine order
indian pharmacy paypal: Indian pharmacy international shipping – pharmacy website india
http://pharm24.pro/# best ed medicine
medicine for ed
best online pharmacy india [url=https://indianpharm24.pro/#]Best Indian pharmacy[/url] top 10 pharmacies in india
prescription without a doctor’s prescription http://pharm24.pro/# best natural cure for ed
medicine in mexico pharmacies: mexican pharm 24 – buying prescription drugs in mexico
bc game hash
http://indianpharm24.pro/# indian pharmacy
ed medications comparison
mexican mail order pharmacies [url=https://mexicanpharm24.cheap/#]mexican pharmacy[/url] medication from mexico pharmacy
how to help ed https://mexicanpharm24.cheap/# mexican border pharmacies shipping to usa
anti fungal pills without prescription: cheap drugs – can ed be cured
world pharmacy india: Best online Indian pharmacy – mail order pharmacy india
vacuum therapy for ed [url=http://pharm24.pro/#]cheap medication[/url] best ed medicine
Короткие цитаты о смысле жизни. Цитаты известных людей.
Смешные приколы и юмор. Делитесь с друзьями. Всегда есть над чем посмеяться.
pharmacies in mexico that ship to usa: Mexican pharmacy ship US – medication from mexico pharmacy
https://mexicanpharm24.cheap/# medicine in mexico pharmacies
over the counter ed drugs
online shopping pharmacy india [url=https://indianpharm24.pro/#]indian pharmacy purchase online[/url] world pharmacy india
oh harika içerik çok beğendim lol script satın al
ed remedies that really work http://pharm24.pro/# mens ed pills
best online pharmacy india [url=https://indianpharm24.pro/#]Indian pharmacy worldwide delivery[/url] buy prescription drugs from india
ed meds online without doctor prescription: buy drugs – best pill for ed
https://pharm24.pro/# best ed treatment pills
ed pills
bcgame
erectile dysfunction remedies https://indianpharm24.pro/# top online pharmacy india
reputable mexican pharmacies online [url=https://mexicanpharm24.cheap/#]mexico pharmacy cheap[/url] mexican pharmaceuticals online
online pharmacy india: medicines from India – mail order pharmacy india
mexican border pharmacies shipping to usa: mexican pharmacy – mexico drug stores pharmacies
http://indianpharm24.pro/# pharmacy website india
what is the best ed pill
indian pharmacy online: India pharmacy international – indian pharmacy paypal
online medication https://pharm24.pro/# erectyle dysfunction
Great! Thank you so much for sharing this. I can’t wait to use it.
http://pharm24.pro/# ed and diabetes
ed treatment pills
ed symptoms: cheap prescription drugs – pills for ed
cheap erectile dysfunction https://mexicanpharm24.cheap/# medication from mexico pharmacy
1win descargar venezuela
http://indianpharm24.pro/# buy prescription drugs from india
ed drugs compared
ed pills otc: low cost prescription – vacuum therapy for ed
Смешные https://smeh.ru и юмор. Делитесь с друзьями. Всегда есть над чем посмеяться.
Лучшие порно видео Гей порно Бонсай скачать бесплатно без регистрации и смс. Смотреть порно онлайн в высоком качестве.
http://pharm24.pro/# ed online pharmacy
injections for ed
india pharmacy: India pharmacy delivery – indian pharmacy
buying from online mexican pharmacy: mexican pharm 24 – buying from online mexican pharmacy
top 10 pharmacies in india: medicines from India – pharmacy website india
otc ed pills https://pharm24.pro/# ed trial pack
http://mexicanpharm24.cheap/# buying prescription drugs in mexico
new treatments for ed
ed problems treatment: cheap drugs online – is it illegal to buy prescription drugs online
buy land buying property in Montenegro
best way to treat ed https://indianpharm24.pro/# Online medicine home delivery
расценки на укладку кафельной плитки https://ukladka-keramogranita-spb.ru
ultrabet giris [url=https://ultrabet-tr.online/#]ultrabet tr online[/url] ultrabet yeni giris 1125
https://slot-tr.online/# slot oyunlar? puf noktalar?
deneme bonusu veren siteler yeni
denemebonusuverensiteler.top https://casinositeleri.win/# Deneme Bonusu Veren Siteler
az parayla cok kazandiran slot oyunlar?: slot oyunlar? puf noktalar? – en cok kazand?ran slot oyunlar?
deneme bonusu veren siteler 2024 https://matadorbet.bid/# matadorbet
slot tr online: az parayla cok kazandiran slot oyunlar? – en kazancl? slot oyunlar?
matadorbet giris [url=https://matadorbet.bid/#]matadorbet bid[/url] matadorbet giris
casino siteleri win [url=https://casinositeleri.win/#]guvenilir casino siteleri[/url] guvenilir casino siteleri
http://slot-tr.online/# slot oyunlar? puf noktalar?
deneme bonusu veren siteler 2024
Тут можно преобрести оружейные сейфы и шкафы ящик для оружия купить
casino siteleri win: Casino Siteleri – guvenilir casino siteleri
en cok kazand?ran slot oyunlar?: slot oyunlar? puf noktalar? – slot oyunlar? puf noktalar?
denemebonusuverensiteler.top http://ultrabet-tr.online/# ultrabet tr online
Если хотите начать игру, скачайте 1xslots бесплатно и начните выигрывать с бонусами.
guvenilir casino siteleri: casino siteleri win – Casino Siteleri
Тут можно домашние сейфы сейф купить
deneme bonusu veren siteler 2024 https://ultrabet-tr.online/# ultrabet
Casino Siteleri [url=http://casinositeleri.win/#]guvenilir casino siteleri[/url] Casino Siteleri
casino siteleri win: Casino Siteleri – casino siteleri win
Тут можно преобрести сейф огнестойкий сейфы от пожара
matadorbet bid [url=https://matadorbet.bid/#]matadorbet bid[/url] matadorbet bid
Займ 250 000 тенге Экспресс займ
провести соут в москве оценка условий труда на рабочем месте
https://matadorbet.bid/# matadorbet bid
denemebonusuverensiteler.top
услуги по оценке условий труда работников соут организации
Займ 200 000 тенге Sravnim.kz
deneme bonusu veren siteler yeni: deneme bonusu veren siteler yeni – deneme bonusu veren yeni siteler
guvenilir casino siteleri: guvenilir casino siteleri – Casino Siteleri
Canl? Casino Siteleri [url=http://casinositeleri.win/#]guvenilir casino siteleri[/url] Canl? Casino Siteleri
matadorbet giris: matadorbet.bid – matadorbet
ultrabet yeni giris 1125: ultrabet tr online – ultrabet tr online
deneme bonusu veren yeni siteler [url=https://denemebonusuverensiteler.top/#]deneme bonusu veren siteler denemebonusu2026.com[/url] denemebonusuverensiteler.top
Тут можно преобрести сейф для охотничьего ружья цена сейфы для оружия купить
deneme bonusu veren siteler http://matadorbet.bid/# matadorbet
deneme bonusu veren siteler: deneme bonusu veren siteler 2024 – deneme bonusu veren siteler betturkey betturkey.com
прокат лыж и сноубордов сколько стоит прокат сноуборд сочи
купить айфон 14 айфон 128 гб цена
прокат горных лыж Адлер прокат лыж красная поляна
deneme bonusu veren siteler yeni [url=https://denemebonusuverensiteler.top/#]deneme bonusu veren siteler yerliarama.org[/url] deneme bonusu veren siteler betturkey betturkey.com
deneme bonusu veren siteler betturkey betturkey.com: denemebonusuverensiteler.top – denemebonusuverensiteler.top
deneme bonusu veren siteler betturkey betturkey.com http://matadorbet.bid/# matadorbet.bid
ultrabet bonus [url=http://ultrabet-tr.online/#]ultrabet guncel[/url] ultrabet bonus
en kazancl? slot oyunlar?: slot oyunlar? puf noktalar? – slot oyunlar? puf noktalar?
slot oyunlar?: slot tr online – slot oyunlar? puf noktalar?
slot oyunlar? puf noktalar? [url=https://slot-tr.online/#]slot oyunlar?[/url] slot siteleri
Тут можно преобрести шкафы оружейные и сейфы сейф для сайги 12
ultrabet yeni giris 1125 [url=https://ultrabet-tr.online/#]ultrabet guncel[/url] ultrabet guncel
Хотите испытать азарт и проверить свою реакцию? Lucky Jet игра отзывы помогут вам узнать, как другие игроки применяют свои стратегии.
Онлайн казино Онлайн казино
deneme bonusu veren yeni siteler https://ultrabet-tr.online/# ultrabet tr online
casino siteleri win: guvenilir casino siteleri – guvenilir casino siteleri
Casino Siteleri: casino siteleri win – guvenilir casino siteleri
deneme bonusu veren siteler betturkey betturkey.com: deneme bonusu veren siteler – denemebonusuverensiteler.top
denemebonusuverensiteler.top https://matadorbet.bid/# matadorbet.bid
ultrabet yeni giris 1125: ultrabet bonus – ultrabet tr online
Casino Siteleri [url=https://casinositeleri.win/#]Casino Siteleri[/url] Canl? Casino Siteleri
укладка кафельной плитки цена за м2 https://ukladka-keramogranita-spb.ru
прокат сноубордов красная Красная Поляна https://prokat-lyzh-krasnaya-polyana.ru
ultrabet tr online: ultrabet bonus – ultrabet giris
Deneme Bonusu Veren Siteler [url=https://casinositeleri.win/#]Canl? Casino Siteleri[/url] casino siteleri win
deneme bonusu veren siteler yerliarama.org http://matadorbet.bid/# matadorbet giris
casino siteleri win: Casino Siteleri – Casino Siteleri
ultrabet guncel [url=https://ultrabet-tr.online/#]ultrabet bonus[/url] ultrabet guncel
deneme bonusu veren siteler yerliarama.org: denemebonusuverensiteler.top – denemebonusuverensiteler.top
ultrabet yeni giris 1125: ultrabet giris – ultrabet tr online
deneme bonusu veren siteler denemebonusu2026.com http://casinositeleri.win/# Casino Siteleri
http://furpharm.com/# buy lasix fur pharm
Kamagra Kam Pharm [url=https://kampharm.shop/#]buy kamagra oral jelly Kam Pharm[/url] Kam Pharm
gabapentin: cheapest Gabapentin GabaPharm – buy gabapentin
https://furpharm.com/# lasix
kamagra: Kam Pharm – buy kamagra oral jelly Kam Pharm
Тут можно преобрести купить огнестойкий сейф в москве огнестойкие сейфы купить
http://rybpharm.com/# buy rybelsus online usa
rybpharm cheap semaglutide [url=https://rybpharm.com/#]buy rybelsus online usa[/url] buy rybelsus
http://rybpharm.com/# buy rybelsus canada
https://rybpharm.com/# buy rybelsus canada
Тут можно преобрести сейф под оружие цена купить сейф оружейный в москве
Kam Pharm: kamagra oral jelly – kamagra oral jelly
https://kampharm.shop/# kamagra oral jelly
kam pharm shop: buy kamagra oral jelly Kam Pharm – kampharm.shop
Чтобы начать выигрывать, просто скачайте приложение БК и начните делать ставки на спорт
kam pharm shop [url=https://kampharm.shop/#]kam pharm shop[/url] kam pharm shop
https://rybpharm.com/# rybpharm
buy rybelsus [url=https://rybpharm.com/#]rybpharm rybelsus[/url] rybpharm
buy rybelsus rybpharm: buy rybelsus online usa – buy rybelsus online usa
https://furpharm.com/# furosemide furpharm.com
https://kampharm.shop/# Kam Pharm
https://furpharm.com/# furpharm
erepharm pills: ED pills non prescription – erepharm pills
erepharm.com [url=http://erepharm.com/#]best ed pills online[/url] ere pharm
стоимость укладка кафельная плитка услуги укладки кафельной плитки
https://rybpharm.com/# semaglutide
Kam Pharm [url=http://kampharm.shop/#]kamagra oral jelly[/url] buy kamagra oral jelly Kam Pharm
casino vavada
https://erepharm.com/# buy ed pills
Сервисный центр предлагает сервис ремонта планшетов onda ремонт планшета onda
GabaPharm: Buy gabapentin for humans – buy gabapentin
buy furosemide online: buy furosemide online – furosemide fur pharm
Тут можно преобрести несгораемый сейф цена купить сейф противопожарный
lasix [url=https://furpharm.com/#]buy lasix fur pharm[/url] furpharm
https://erepharm.com/# ED meds online with insurance
https://furpharm.com/# buy lasix fur pharm
ED pills non prescription [url=https://erepharm.com/#]ed pills[/url] ED meds online
http://erepharm.com/# ere pharm
http://rybpharm.com/# semaglutide
buy kamagra oral jelly Kam Pharm: kamagra oral jelly – kamagra
1win app
kamagra oral jelly: Kamagra Kam Pharm – Kam Pharm
Тут можно преобрести сейф под оружие цена купить сейф для ружья
https://rybpharm.com/# rybpharm cheap semaglutide
kam pharm shop [url=https://kampharm.shop/#]Kamagra Kam Pharm[/url] kam pharm shop
Для азартных игроков есть скачать Лаки джет и начать зарабатывать.
https://kampharm.shop/# kampharm.shop
kampharm.shop: kam pharm shop – buy kamagra oral jelly Kam Pharm
http://kampharm.shop/# kampharm shop
http://erepharm.com/# ed pills
cheapest Kamagra Kam Pharm: kam pharm shop – buy kamagra oral jelly Kam Pharm
rybpharm cheap semaglutide [url=http://rybpharm.com/#]semaglutide[/url] rybpharm rybelsus
neon54 bonus
buy rybelsus rybpharm: rybpharm rybelsus – rybpharm rybelsus
http://gabapharm.com/# buy gabapentin online
ere pharm [url=https://erepharm.com/#]erepharm.com[/url] ere pharm
Здесь можно преобрести где купить сейф сейф
Kamagra Kam Pharm: kamagra oral jelly – kampharm.shop
kamagra oral jelly [url=http://kampharm.shop/#]buy kamagra oral jelly Kam Pharm[/url] kampharm shop
erepharm.com: ere pharm – erepharm.com
http://furpharm.com/# furosemide fur pharm
fur pharm: furosemide furpharm.com – fur pharm
buy gabapentin online [url=http://gabapharm.com/#]buy Gabapentin GabaPharm[/url] GabaPharm Gabapentin
услуги спецоценка условий труда услуги соут
https://rybpharm.com/# rybpharm
1win
furosemide fur pharm: buy lasix fur pharm – furpharm
Тут можно преобрести сейф огнестойкий в москве огнеупорный сейф купить
Very interesting subject , thanks for posting.
https://erepharm.com/# erepharm.com
Kamagra Kam Pharm [url=https://kampharm.shop/#]kamagra oral jelly[/url] Kamagra Kam Pharm
http://kampharm.shop/# Kam Pharm
https://furpharm.com/# furpharm
Тут можно преобрести сейфы под оружие сейфы под оружие
buy ed pills [url=http://erepharm.com/#]ED meds online with insurance[/url] erepharm pills
lasix: cheapest lasix – furosemide fur pharm
furosemide furpharm.com: buy furosemide online – lasix
This high-flying game offers a unique betting experience where Indian players can test their nerve and timing. Aviator allows for both free demo and real money play—perfect for beginners and risk-takers alike.
aviator game online [url=https://aviator-games-online.ru/]aviator online game[/url] .
neon54 slot
world pharmacy india [url=https://indianpharmacyeasy.com/#]Indian online pharmacy ship to usa[/url] india pharmacy
https://canadiandrugsgate.com/# ed doctor
indianpharmacy com [url=http://indianpharmacyeasy.com/#]Best Indian pharmacy[/url] top online pharmacy india
buy medicines online in india: Best online Indian pharmacy – indian pharmacies safe
http://indianpharmacyeasy.com/# india online pharmacy
Тут можно преобрести огнеупорный сейф купить купить огнестойкий сейф в москве
http://indianpharmacyeasy.com/# buy medicines online in india
http://canadiandrugsgate.com/# erection pills online
mexican online pharmacies prescription drugs: mexican pharmacy online – mexico drug stores pharmacies
https://canadiandrugsgate.com/# ed men
Готов услышать трек, который выбьет из тебя все оправдания? Слушай, если не боишься правды.
Great! Thank you so much for sharing this. I can’t wait to use it.
Great! Thank you so much for sharing this. I can’t wait to use it.
Тут можно преобрести оружейные сейфы москва сейфы для оружия купить
http://canadiandrugsgate.com/# erectile dysfunction treatment
buy prescription drugs from india: indian pharmacy easy – top 10 online pharmacy in india
http://canadiandrugsgate.com/# shots for ed
Online medicine home delivery: Online Indian pharmacy – indian pharmacy online
vavada kazino
https://canadiandrugsgate.com/# vacuum pumps for ed
How can I get the computer in one room to send stuff to the printer on my computer in another room. Internet?
how to help ed [url=https://canadiandrugsgate.com/#]Canadian pharmacy online[/url] buying pills online
mexico pharmacies prescription drugs: mexico pharmacy – mexican online pharmacies prescription drugs
purple pharmacy mexico price list: MexicanPharmGate – reputable mexican pharmacies online
https://mexicanpharmgate.com/# mexico drug stores pharmacies
purple pharmacy mexico price list [url=http://mexicanpharmgate.com/#]mexican pharmacy[/url] pharmacies in mexico that ship to usa
https://mexicanpharmgate.com/# pharmacies in mexico that ship to usa
reputable mexican pharmacies online: mexican drugstore online – buying from online mexican pharmacy
https://canadiandrugsgate.com/# erectile dysfunction natural remedies
Тут можно преобрести купить сейф огнестойкий в москве огнеупорные сейфы
Сервисный центр предлагает ремонт packard bell easynote ts11 в петербурге ремонт packard bell easynote ts11 цены
ways to treat erectile dysfunction: Canadian pharmacy online – online ed medications
http://mexicanpharmgate.com/# medicine in mexico pharmacies
Тут можно преобрести сейфы для ружей сейф оружейный купить
bc game app download
http://canadiandrugsgate.com/# online medication
pharmacies in mexico that ship to usa: mexican pharmacy online medications – best online pharmacies in mexico
Play top games on 888Starz Pakistan and enjoy exclusive bonuses.
https://indianpharmacyeasy.com/# indian pharmacy online
buy prescription drugs from india: Indian pharmacy international shipping – online pharmacy india
https://canadiandrugsgate.com/# buying ed pills online
impotance: canadiandrugsgate.com – erection problems
online medications [url=https://canadiandrugsgate.com/#]canadian pharmacy[/url] buy medications online
mexico drug stores pharmacies [url=http://mexicanpharmgate.com/#]mexican pharmacy online medications[/url] buying from online mexican pharmacy
6 win
Great! Thank you so much for sharing this. I can’t wait to use it.
Great! Thank you so much for sharing this. I can’t wait to use it.
https://canadiandrugsgate.com/# buying pills online
ed in men: canadian pharmacy drugs gate – errection problem cure
cheapest online pharmacy india: Indian pharmacy to USA – top 10 online pharmacy in india
pharmacy website india: indian pharmacy – indianpharmacy com
https://indianpharmacyeasy.com/# indian pharmacies safe
Готов услышать трек, который выбьет из тебя все оправдания? Слушай, если не боишься правды.
mens ed: Canada pharmacy online – ed in young men
http://indianpharmacyeasy.com/# indianpharmacy com
Тут можно преобрести заказать оружейный сейф купить шкаф оружейный
Тут можно преобрести сейф москва огнестойкий купить огнеупорные сейфы
The information provided in Special precautions for disposal and other handling of Tamosan is based on data of another medicine with exactly the same composition as the Tamosan priligy over the counter
mail order pharmacy india [url=https://indianpharmacyeasy.com/#]Online medicine home delivery[/url] indian pharmacies safe
vavada bonus
Online medicine home delivery: indianpharmacyeasy – pharmacy website india
natural ed pills [url=https://canadiandrugsgate.com/#]Canadian pharmacy best prices[/url] medicines for ed
https://canadiandrugsgate.com/# cheapest ed pills
online shopping pharmacy india: indianpharmacyeasy.com – top 10 online pharmacy in india
reputable indian online pharmacy: indian pharmacy – п»їlegitimate online pharmacies india
Здесь можно преобрести сейф купить москва стоимость сейфа
https://canadiandrugsgate.com/# cheap ed medication
http://mexicanpharmgate.com/# buying prescription drugs in mexico
mexican rx online: MexicanPharmGate – buying prescription drugs in mexico
With huge multipliers and quick decision-making, Aviator has become a favorite among Indian online players. Use the demo to master your skills, then cash out in real money play before the plane flies away!
play aviator online [url=https://aviator-games-online.ru/]aviator real money game[/url] .
cheap clomid pills [url=https://clomidrexpharm.com/#]clomid online[/url] clomid no prescription
Great! Thank you so much for sharing this. I can’t wait to use it.
where to get generic clomid: get clomid no prescription – how can i get cheap clomid
Great! Thank you so much for sharing this. I can’t wait to use it.
where to buy generic clomid now [url=http://clomidrexpharm.com/#]buy clomid[/url] can i purchase generic clomid without prescription
amoxicillin 500 http://priligymaxpharm.com/# cheap priligy
amoxicillin 500mg capsules uk https://priligymaxpharm.com/# buy priligy max pharm
dapoxetine online: buy dapoxetine online – cheap priligy
prednisone price australia: ray pharm – buy prednisone online without a script
Explora el mundo de los casinos online en 1xslots online casino.
buy priligy max pharm: priligy – buy priligy max pharm
prednisone online [url=http://prednisoneraypharm.com/#]generic Prednisone[/url] where to buy prednisone without prescription
price of amoxicillin without insurance http://amoxilcompharm.com/# can you buy amoxicillin over the counter in canada
Тут можно преобрести сейф для охотничьего ружья купить купить шкаф для ружья
prednisone 20 mg generic: cheap prednisone – buy prednisone tablets online
can i order clomid: generic clomid – cost of generic clomid without prescription
prednisone 10mg tablet cost [url=https://prednisoneraypharm.com/#]order Prednisone[/url] prednisone uk buy
amoxicillin 500mg capsules price https://priligymaxpharm.com/# buy priligy
prednisone 20 mg generic: prednisoneraypharm – prednisone 5 mg tablet cost
buy priligy: dapoxetine online – cheap priligy
40 mg prednisone pill: order Prednisone – by prednisone w not prescription
amoxicillin 50 mg tablets [url=https://amoxilcompharm.com/#]com pharm[/url] order amoxicillin online no prescription
order cheap clomid: generic clomid – where to get clomid no prescription
20 mg prednisone: prednisoneraypharm – prednisone daily use
amoxicillin 500mg no prescription: amoxil – how much is amoxicillin
where can i buy amoxicillin over the counter [url=https://amoxilcompharm.com/#]cheap amoxil[/url] amoxicillin 500mg capsule buy online
order amoxicillin online uk https://priligymaxpharm.com/# buy priligy max pharm
buy amoxicillin 500mg canada: amoxicillin generic – where can i buy amoxicillin without prec
purchase amoxicillin online without prescription: Amoxicillin for sale – can you purchase amoxicillin online
amoxicillin 500 mg tablet price: Amoxicillin Com Pharm – amoxicillin buy no prescription
prednisone 20 mg without prescription [url=https://prednisoneraypharm.com/#]Prednisone Without Prescription[/url] prednisone 20mg tab price
Предлагаем услуги профессиональных инженеров офицальной мастерской.
Еслли вы искали официальный сервисный центр xiaomi, можете посмотреть на сайте: сервисный центр xiaomi в москве
Наши мастера оперативно устранят неисправности вашего устройства в сервисе или с выездом на дом!
how to buy cheap clomid online: clomid purchase online rex pharm – can i buy clomid without a prescription
generic amoxicillin online [url=https://amoxilcompharm.com/#]Amoxicillin Com Pharm[/url] rexall pharmacy amoxicillin 500mg
prednisone 100 mg: cheap prednisone – prednisone brand name india
generic clomid without prescription: buy clomid – can i order clomid without prescription
prednisone 20mg tab price: prednisone 40mg – buy prednisone online paypal
50 mg prednisone canada pharmacy: Prednisone Without Prescription – buy prednisone 10mg online
Тут можно преобрести сейфы для оружия москва купить сейф оружейный в москве
prednisone without a prescription: raypharm – prednisone 20 mg tablet
охрана труда дистанционное обучение курсы москва охрана труда дистанционное обучение курсы в москве
BBgate MarketPlace 2024 Breaking Bad Gate Forum
BBgate MarketPlace
where can you get amoxicillin: Amoxicillin Com Pharm – where can i buy amoxicillin online
max pharm: priligy – dapoxetine price
priligy: priligy maxpharm – buy priligy
order clomid without a prescription: buy clomid – can i get cheap clomid online
can you buy cheap clomid without prescription: cost clomid without a prescription – clomid for sale
where can i buy generic clomid without a prescription: rex pharm – can you buy generic clomid for sale
amoxicillin 500mg pill: amoxil – amoxacillian without a percription
where to get cheap clomid for sale: clomid rex pharm – how can i get cheap clomid price
where to buy clomid tablets: buy clomid – can you buy generic clomid for sale
amoxicillin without rx: Com Pharm – buy amoxicillin 500mg uk
where to buy cheap clomid without prescription: buy clomid – can i order generic clomid price
neon54 casino promo code
скачать приложения онлайн казино https://lasmercedes.ar/r7-casino-oficialnyj-sajt-12/
http://cytpremium.com/# cytotec pills buy online
amoxicillin cephalexin: com pharm – buy amoxicillin online mexico
mexican rx online https://mexicanpharmgate.com/ mexico pharmacies prescription drugs
buy Lisinopril online: lisinopril1st – lisinopril1st
buying prescription drugs in mexico http://mexicanpharmgate.com/ п»їbest mexican online pharmacies
vavada bonus
ivermectin 0.1 [url=http://iverfast.com/#]buy Ivermectin online[/url] ivermectin 10 mg
https://iverfast.com/# cost of ivermectin 1% cream
ivermectin pills canada: minocycline online – stromectol order online
pharmacies in mexico that ship to usa https://mexicanpharmgate.com/ purple pharmacy mexico price list
how much is prednisone 10 mg: cheap prednisone – prednisone 1 mg for sale
amoxicillin generic brand: com pharm – can i buy amoxicillin over the counter in australia
Cytotec 200mcg price: buy cytotec cytpremium – purchase cytotec
price of stromectol [url=http://iverfast.com/#]ivermectin price comparison[/url] minocycline for acne 100mg
1 win casino venezuela
cheap plavix antiplatelet drug: Plavix Clo – п»їplavix generic
priligy maxpharm: priligy – buy priligy max pharm
https://lisinopril1st.com/# lisinopril1st
Cost of Plavix without insurance [url=https://plavixclo.com/#]plavix medication[/url] generic plavix
prednisone 10mg cost: cheap prednisone – can you buy prednisone over the counter in mexico
6 win bet
cheap plavix antiplatelet drug: Plavix Clo – Plavix generic price
https://plavixclo.com/# cheap plavix antiplatelet drug
cheapest Lisinopril: cheapest Lisinopril – cheapest Lisinopril
lisinopril cost [url=http://lisinopril1st.com/#]cheap lisinopril no prescription[/url] buy Lisinopril online
buy cheap amoxicillin online: Amoxicillin for sale – amoxicillin pharmacy price
https://iverfast.com/# buy stromectol uk
buy Lisinopril 1st: cheapest Lisinopril – buy Lisinopril online
Most Popular Earning App in Pakistan|Easy Way to Earn in Pakistan|Earning Potential in Pakistan|Efficient Earning Tool in Pakistan|Profitable Earning App in Pakistan|Economic Earning in Pakistan|Successful Processing Method in Pakistan|Best app for earning in Pakistan: time-tested|Effective methods of earning in Pakistan|Innovative approach to earning in Pakistan
apps for earning money in pakistan [url=https://bestearningappinpakistan.com/]watch ads for money[/url] .
buy cytotec pills [url=https://cytpremium.com/#]buy cytotec online[/url] purchase cytotec
Most Popular Money Making Apps in Pakistan, Money Earning Apps That Shape Your Financial Situation in Pakistan
new earning app in pakistan [url=https://earningappinpakistan.com/]earning apps in pakistan[/url] .
п»їplavix generic: PlavixClo – п»їplavix generic
http://lisinopril1st.com/# Lisinopril 1st
Best Apps to Make Money in Pakistan, How to Make Money in Pakistan Using a Mobile App, Secret Methods to Make Money in Pakistan, Optimal Apps to Make Money in Pakistan, The most effective applications for earning money in Pakistan, Is it possible to earn money in Pakistan through applications?, Safe ways to earn money in Pakistan through applications, Modern ways to earn money in Pakistan through applications, with new opportunities for earning money, to increase financial flow, Effective strategies for making money in Pakistan through apps, Updated platforms for making money in Pakistan, How to make money in Pakistan using mobile apps: simple and profitable, Easy ways to make money in Pakistan through apps, Unique ways to make money in Pakistan through apps, which will help you achieve financial stability, for making money at any time of the day, which will open up new opportunities for earning moneybest online earning websites in pakistan [url=https://makemoneyonlinehappy.com/]best earning app in pakistan[/url] .
where to buy amoxicillin pharmacy: amoxil – buy amoxicillin
buy cytotec online: buy cytotec online – buy misoprostol over the counter
https://plavixclo.com/# Cost of Plavix on Medicare
dapoxetine online: priligy – Priligy tablets
lisinopril 2.5 cost: buy Lisinopril 1st – prescription drug prices lisinopril
https://cytpremium.com/# cytotec abortion pill
zestril price in india [url=http://lisinopril1st.com/#]cheapest Lisinopril[/url] buy Lisinopril online
prednisone over the counter australia: buy cheap prednisone – average cost of prednisone
buy Lisinopril online: where can i buy lisinopril – buy Lisinopril 1st
vavada online
http://cytpremium.com/# buy cytotec pills online cheap
buy Lisinopril 1st: Lisinopril 1st – buy Lisinopril online
neon54 online casino
пин ап кз: pin up казино – pinup
pinup-kazi.kz: пин ап кз – pinup-kazi.kz
вавада казино: vavada-kazi.ru – вавада казино онлайн
pinup-kazi.kz: pinup-kazi.kz – pinup kazi
вавада казино зеркало: vavada kazi – vavada
пинап казино: pinup-kazi.kz – pinup
1win casino mocambique
Предлагаем услуги профессиональных инженеров офицальной мастерской.
Еслли вы искали сервисный центр philips в москве, можете посмотреть на сайте: сервисный центр philips
Наши мастера оперативно устранят неисправности вашего устройства в сервисе или с выездом на дом!
pinup-kazi.ru: pinup-kazi.ru – пин ап вход
pinup-kazi.ru: пин ап казино официальный сайт – pinup kazi
pin up казино: pinup-kazi.kz – pinup
pinup kazi: пин ап казино официальный сайт – пин ап зеркало
вавада: vavada-kazi.ru – вавада казино онлайн
vavada-kazi.ru: казино вавада – вавада казино онлайн
вавада онлайн казино: vavada – вавада онлайн казино
http://pinup-kazi.kz/# пинап казино
pinup kazi [url=http://pinup-kazi.ru/#]pinup[/url] пин ап вход
пин ап кз: pin up казино – пин ап казино
казино вавада: вавада казино зеркало – вавада казино зеркало
pinup-kazi.kz: пинап казино – pin up казино
neon54 ????????
вавада казино: вавада онлайн казино – вавада казино
пинап казино: пин ап вход – pinup kazi
Professional translation ensures that written content conveys the original message accurately across languages. True translation respects cultural nuances, technical terms, and the original text’s essence. Skilled translators craft messages that connect effectively with diverse audiences.
Explore what’s new and exciting about on our website translation of marriage certificate
pin up казино: pinup-kazi.kz – пин ап казино онлайн
пин ап казино: pinup-kazi.kz – pin up казино
вавада онлайн казино [url=http://vavada-kazi.ru/#]вавада казино онлайн[/url] vavada-kazi.ru
вавада казино онлайн: vavada-kazi.ru – вавада казино онлайн
pinup: pinup-kazi.ru – pinup
https://pinup-kazi.kz/# pinup
вавада: vavada-kazi.ru – вавада казино зеркало
оказание услуг по специальной оценке условий труда в москве соут работников
pinup kazi: pinup kazi – пинап казино
вавада казино онлайн: казино вавада – вавада
пинап казино: pinup – pinup-kazi.kz
bc game online
пин ап казино онлайн: pinup – pin up казино
пин ап кз [url=https://pinup-kazi.kz/#]pinup[/url] pinup-kazi.kz
https://vavada-kazi.ru/# вавада онлайн казино
pin up казино: pin up казино – pinup kazi
Финансовый маркетплейс для жителей Казахстана предлагает удобный способ подбора кредитов, ипотеки, микрозаймов и других финансовых продуктов. На сайте собраны лучшие предложения от надежных банков и МФО.
Микрокредиты [url=https://finance-online.kz/]банки Казахстана[/url] .
провести соут провести оценку соут
vavada kazi: вавада казино – вавада казино зеркало
вавада: вавада казино онлайн – vavada
pin up казино: пин ап кз – пин ап казино онлайн
http://pinup-kazi.ru/# пин ап вход
pinup kazi: пин ап казино – pinup
пин ап кз [url=https://pinup-kazi.kz/#]pin up казино[/url] pinup-kazi.kz
vavada: vavada – вавада казино зеркало
https://pinup-kazi.ru/# pinup-kazi.ru
pinup-kazi.ru: пин ап казино – pinup kazi
soma therapy ed: canada pharmacy online – natural ed pills
buying prescription drugs in mexico: mexican pharm easy – purple pharmacy mexico price list
cheapest online pharmacy india: IndianPharmStar – online pharmacy india
natural ed [url=http://canadianpharm1st.com/#]canadian pharmacy[/url] ed pills that work quickly
[url=https://www.0432.ua/list/458330]купить виртуальный номер навсегда[/url]
india pharmacy mail order [url=https://indianpharmstar.com/#]IndianPharmStar[/url] best online pharmacy india
ed in men: canadianpharm1st – pet meds without vet prescription
top 10 online pharmacy in india: indian pharmacy – buy medicines online in india
Федерация – это проводник в мир покупки запрещенных товаров, можно купить мефедрон, купить кокаин, купить меф, купить экстази в различных городах. Москва, Санкт-Петербург, Краснодар, Владивосток, Красноярск, Норильск, Екатеринбург, Мск, СПБ, Хабаровск, Новосибирск, Казань и еще 100+ городов.
online canadian drugstore: canadianpharm1st – ed drugs list
prescription drugs without prior prescription: canadianpharm1st.com – treating ed
best ed pills: canadian pharm 1st – ed meds pills drugs
buying from online mexican pharmacy [url=https://mexicanpharmeasy.com/#]Mexican Pharm[/url] medicine in mexico pharmacies
ed pills online: canadian pharm – cheap pills online
mexican pharmaceuticals online: mexican pharm easy – purple pharmacy mexico price list
best online pharmacy india: IndianPharmStar.com – best india pharmacy
pain medications without a prescription [url=https://canadianpharm1st.com/#]canadianpharm1st.com[/url] how to fix ed
male dysfunction: canada pharmacy online – home remedies for ed
reputable indian pharmacies: indian pharmacy – pharmacy website india
best online pharmacies in mexico: Pharm Easy – mexican pharmaceuticals online
ed pills online pharmacy: canada pharmacy online – how to get prescription drugs without doctor
ed causes and cures [url=https://canadianpharm1st.com/#]canadianpharm1st.com[/url] best ed solution
ed pills that work: canadian pharm 1st – prescription drugs
generic ed pills: canadian pharm 1st – drugs that cause ed
ed vacuum pumps: canadian pharm – online prescription for ed meds
indian pharmacy paypal [url=https://indianpharmstar.com/#]IndianPharmStar.com[/url] indian pharmacy
best ed medication http://canadianpharm1st.com/# buy ed pills
ed medication online: canada pharmacy online – buy medications online
pharmacies in mexico that ship to usa: MexicanPharmEasy – п»їbest mexican online pharmacies
ed clinic: canadian pharmacy – buy online drugs
mexican pharmaceuticals online: MexicanPharmEasy – pharmacies in mexico that ship to usa
top 10 pharmacies in india [url=https://indianpharmstar.com/#]indian pharm[/url] mail order pharmacy india
mexican mail order pharmacies: mexican pharm easy – buying from online mexican pharmacy
mexican drugstore online [url=https://mexicanpharmeasy.com/#]Mexican Pharm[/url] mexican online pharmacies prescription drugs
ed pills online pharmacy https://indianpharmstar.com/# top 10 online pharmacy in india
canadian drug pharmacy: canadian pharmacy – erectyle dysfunction
buy drug online: canadianpharm1st.com – medication drugs
buy prescription drugs from india [url=http://indianpharmstar.com/#]indian pharmacy[/url] top 10 pharmacies in india
ed meds online without doctor prescription: canadian pharm 1st – legal to buy prescription drugs from canada
over the counter ed medication http://indianpharmstar.com/# reputable indian online pharmacy
ed supplements: canadian pharm – ed drugs over the counter
india pharmacy mail order: indian pharm star – top online pharmacy india
how to cure ed http://mexicanpharmeasy.com/# mexico drug stores pharmacies
non prescription erection pills: canadian pharm 1st – ed medications comparison
ed remedies that really work [url=https://canadianpharm1st.com/#]canadianpharm1st.com[/url] drugs prices
buying prescription drugs in mexico: mexican pharmacy – reputable mexican pharmacies online
erection problems: canada pharmacy online – buy online pharmacy
mexican pharmaceuticals online [url=http://mexicanpharmeasy.com/#]Mexican Pharm[/url] medicine in mexico pharmacies
ed symptoms http://canadianpharm1st.com/# ed pills that work quickly
cheapest online pharmacy india: indian pharmacy – indian pharmacy online
cialis without doctor prescription: canadian pharmacy – best male enhancement
buy anti biotics without prescription http://indianpharmstar.com/# india online pharmacy
best india pharmacy [url=http://indianpharmstar.com/#]indian pharm[/url] indian pharmacy
reputable indian pharmacies: IndianPharmStar.com – india pharmacy
the best ed drug: canadian pharm – male erection pills
Предлагаем услуги профессиональных инженеров офицальной мастерской.
Еслли вы искали сервисный центр asus сервис, можете посмотреть на сайте: сервисный центр asus цены
Наши мастера оперативно устранят неисправности вашего устройства в сервисе или с выездом на дом!
cat antibiotics without pet prescription: canada pharmacy online – top erection pills
male ed [url=http://canadianpharm1st.com/#]canadian pharmacy[/url] errectile dysfunction
Online medicine order: indian pharm star – indian pharmacy
best online pharmacies in mexico: mexican pharm easy – pharmacies in mexico that ship to usa
ed pills online pharmacy http://canadianpharm1st.com/# male ed pills
india pharmacy [url=https://indianpharmstar.com/#]IndianPharmStar.com[/url] india pharmacy
purple pharmacy mexico price list: Mexican Pharm – mexican rx online
pump for ed: canadian pharm 1st – erection pills that work
medicine in mexico pharmacies: MexicanPharmEasy – mexican drugstore online
prescription drugs online without doctor: canadian pharmacy – erection pills viagra online
Online medicine order [url=https://indianpharmstar.com/#]indian pharmacy[/url] india pharmacy mail order
ed remedies that really work http://canadianpharm1st.com/# natural herbs for ed
prices of viagra at walmart: canadianpharm1st.com – best treatment for ed
buying prescription drugs in mexico online [url=http://mexicanpharmeasy.com/#]mexicanpharmeasy.com[/url] medicine in mexico pharmacies
india online pharmacy: indian pharm – online pharmacy india
paxlovid covid: paxlovid generic – paxlovid buy
paxlovid cost without insurance [url=https://paxlovid.ink/#]п»їpaxlovid[/url] Paxlovid.ink
https://ivermectinpharm.store/# Ivermectin Pharm
Paxlovid.ink [url=https://paxlovid.ink/#]paxlovid pharmacy[/url] paxlovid india
http://amoxilpharm.store/# amoxicillin pills 500 mg
https://semaglutidepharm.com/# semaglutide
Ivermectin Pharm Store [url=https://ivermectinpharm.store/#]minocycline indications[/url] minocycline 50 mg without doctor
rybelsus price: Semaglutide pharmacy price – rybelsus generic
Buy compounded semaglutide online: rybelsus cost – Buy compounded semaglutide online
Semaglutide pharmacy price: Rybelsus 7mg – rybelsus cost
https://semaglutidepharm.com/# Semaglutide pharmacy price
Buy semaglutide pills [url=http://semaglutidepharm.com/#]rybelsus cost[/url] cheap Rybelsus 14 mg
Amoxil Pharm Store: AmoxilPharm – amoxicillin price canada
http://ivermectinpharm.store/# Buy Online Ivermectin/Stromectol Now
Gabapentin Pharm: Gabapentin Pharm – neurontin 214
paxlovid pill: paxlovid for sale – paxlovid covid
https://amoxilpharm.store/# AmoxilPharm
https://ivermectinpharm.store/# Ivermectin Pharm Store
amoxicillin 500 mg tablets [url=https://amoxilpharm.store/#]Amoxil Pharm Store[/url] AmoxilPharm
canada neurontin 100mg lowest price: Gabapentin Pharm – neurontin pill
I think this web site has got very great written subject matter content.
Buy compounded semaglutide online [url=https://semaglutidepharm.com/#]semaglutide pharm[/url] Semaglutide pharmacy price
rybelsus price: Rybelsus 7mg – buy rybelsus
amoxicillin over counter: AmoxilPharm – buy amoxicillin over the counter uk
https://ivermectinpharm.store/# Ivermectin Pharm Store
https://ivermectinpharm.store/# ivermectin price usa
paxlovid pharmacy [url=https://paxlovid.ink/#]paxlovid generic[/url] Paxlovid buy online
paxlovid pill: Paxlovid over the counter – Paxlovid.ink
paxlovid price: Paxlovid.ink – Paxlovid.ink
buy rybelsus: cheap Rybelsus 14 mg – rybelsus generic
https://amoxilpharm.store/# Amoxil Pharm Store
Gabapentin Pharm [url=https://gabapentinpharm.com/#]generic neurontin cost[/url] Gabapentin Pharm
Paxlovid.ink: paxlovid for sale – Paxlovid buy online
https://amoxilpharm.store/# amoxicillin 500mg buy online uk
neurontin for sale: medication neurontin – Gabapentin Pharm
Gabapentin Pharm: Gabapentin Pharm – neurontin 400 mg tablets
paxlovid generic [url=https://paxlovid.ink/#]Paxlovid.ink[/url] Paxlovid.ink
AmoxilPharm: AmoxilPharm – Amoxil Pharm Store
https://gabapentinpharm.com/# neurontin 300 mg cap
Buy Online Ivermectin/Stromectol Now: Ivermectin Pharm Store – ivermectin 200mg
rybelsus generic: semaglutide – semaglutide pharm
paxlovid cost without insurance: Paxlovid.ink – Paxlovid buy online
https://amoxilpharm.store/# buy amoxicillin 250mg
Насладитесь игрой в казино онлайн, станьте победителем.
Проникнитесь атмосферой казино онлайн, достижение успеха рядом.
Находите лучшие игровые площадки, доверьтесь профессионалам.
Увеличьте свой банкролл с казино онлайн, делая ставки на спортивные события.
Присоединяйтесь к сообществу азартных игроков, испытывайте азарт в полной мере.
Играйте и выигрывайте вместе с лучшими, трансформируйте свою жизнь.
Почувствуйте реальный азарт игры в казино онлайн, получая максимум удовольствия.
Разнообразие игр ждет вас в онлайн казино, играйте на любом устройстве.
Получайте удовольствие от игры в казино онлайн, завоюйте вершину мира азарта.
Играйте в онлайн казино смартфоне, выбирая любимые игры.
Сделайте свою жизнь более увлекательной с казино онлайн, получая яркие эмоции.
Станьте лидером в мире игр, получая удовольствие от побед.
Примите вызов и выиграйте крупный джекпот, соревнуйтесь с сильнейшими игроками.
Станьте частью крупных турниров и соревнований, практикуя различные подходы.
Казино [url=https://t.me/s/casinobelorus/]онлайн казино беларусь[/url] .
https://paxlovid.ink/# Paxlovid over the counter
semaglutide pharm [url=https://semaglutidepharm.com/#]Buy compounded semaglutide online[/url] cheap Rybelsus 14 mg
paxlovid india: п»їpaxlovid – Paxlovid.ink
buy liquid ivermectin: Ivermectin Pharm – stromectol 3 mg tablets price
Paxlovid buy online: Paxlovid.ink – buy paxlovid online
https://gabapentinpharm.com/# Gabapentin Pharm
AmoxilPharm [url=https://amoxilpharm.store/#]Amoxil Pharm Store[/url] how to get amoxicillin
Rybelsus 7mg: rybelsus price – cheap Rybelsus 14 mg
semaglutide pharm: buy rybelsus – Buy compounded semaglutide online
Ivermectin Pharm: Ivermectin Pharm Store – Ivermectin Pharm
https://paxlovid.ink/# paxlovid generic
https://ivermectinpharm.store/# Ivermectin Pharm Store
Paxlovid.ink [url=http://paxlovid.ink/#]п»їpaxlovid[/url] Paxlovid.ink
https://semaglutidepharm.com/# rybelsus
Gabapentin Pharm: Gabapentin Pharm – Gabapentin Pharm
Ivermectin Pharm Store: stromectol 3 mg – Ivermectin Pharm
buy rybelsus: cheap Rybelsus 14 mg – rybelsus generic
Gabapentin Pharm: neurontin gabapentin – Gabapentin Pharm
Paxlovid.ink [url=http://paxlovid.ink/#]paxlovid for sale[/url] Paxlovid.ink
https://semaglutidepharm.com/# rybelsus generic
semaglutide pharm [url=https://semaglutidepharm.com/#]rybelsus cost[/url] Buy semaglutide pills
https://amoxilpharm.store/# Amoxil Pharm Store
where to get clomid prices: can i order generic clomid without insurance – where can i get generic clomid no prescription
order cytotec online [url=https://cytotec.top/#]cytotec abortion pill[/url] buy cytotec
lisinopril 12.5 tablet: zestril tablet – medication lisinopril 20 mg
https://clomid.store/# generic clomid
[url=][/url]
Временная регистрация в СПб: Быстро и Легально!
Ищете, где оформить временную регистрацию в Санкт-Петербурге?
Мы гарантируем быстрое и легальное оформление без очередей и лишних документов.
Ваше спокойствие – наша забота!
Минимум усилий • Максимум удобства • Полная легальность
Свяжитесь с нами прямо сейчас!
Временная регистрация
[url=][/url]
clomid without rx: buy generic clomid without insurance – order cheap clomid without prescription
http://azithromycinus.com/# zithromax buy
how can i get clomid for sale [url=https://clomid.store/#]can i get clomid without insurance[/url] where can i buy generic clomid pills
http://azithromycinus.com/# zithromax cost uk
cytotec pills buy online [url=https://cytotec.top/#]buy cytotec over the counter[/url] buy cytotec over the counter
can you get cheap clomid without rx: can i order cheap clomid without a prescription – cost of generic clomid
buy cytotec pills online cheap: buy misoprostol over the counter – cytotec abortion pill
buy cytotec over the counter [url=https://cytotec.top/#]buy misoprostol over the counter[/url] buy cytotec in usa
http://cytotec.top/# buy cytotec pills online cheap
order cytotec online [url=https://cytotec.top/#]order cytotec online[/url] order cytotec online
https://ciprofloxacin.cheap/# ciprofloxacin over the counter
zithromax 250mg [url=https://azithromycinus.com/#]zithromax 500[/url] zithromax online usa
buy cipro: cipro 500mg best prices – cipro pharmacy
order cheap clomid pills: where can i buy generic clomid – how to buy clomid online
[url=][/url]
Временная регистрация в Санкт-Петербурге: Быстро и Легально!
Ищете, где оформить временную регистрацию в СПб?
Мы гарантируем быстрое и легальное оформление без очередей и лишних документов.
Ваше спокойствие – наша забота!
Минимум усилий • Максимум удобства • Полная легальность
Свяжитесь с нами прямо сейчас!
Временная регистрация в СПб
[url=][/url]
http://clomid.store/# buying generic clomid without insurance
cipro 500mg best prices [url=http://ciprofloxacin.cheap/#]cipro pharmacy[/url] purchase cipro
lisinopril from mexico [url=http://lisinoprilus.com/#]lisinopril from canada[/url] zestoretic 20 25 mg
can i purchase generic clomid without rx: where to buy generic clomid pill – where can i get generic clomid no prescription
lisinopril 3972: 2 prinivil – lisinopril generic over the counter
https://lisinoprilus.com/# zestoretic 20 25
buy ciprofloxacin [url=https://ciprofloxacin.cheap/#]buy cipro without rx[/url] buy cipro without rx
https://clomid.store/# where buy clomid
buy cytotec in usa [url=https://cytotec.top/#]Cytotec 200mcg price[/url] cytotec buy online usa
https://clomid.store/# cost of cheap clomid no prescription
buy cipro online canada: cipro online no prescription in the usa – buy cipro without rx
buy cipro online canada: cipro ciprofloxacin – buy generic ciprofloxacin
can i order cheap clomid pills: where can i get cheap clomid pill – can i buy clomid no prescription
https://ciprofloxacin.cheap/# buy cipro online canada
https://lisinoprilus.com/# zestril 10 mg cost
purchase cytotec [url=http://cytotec.top/#]cytotec pills buy online[/url] cytotec online
buy ciprofloxacin over the counter: where to buy cipro online – buy cipro no rx
lisinopril 12.5 mg 20 mg [url=https://lisinoprilus.com/#]order lisinopril 20mg[/url] lisinopril 10 mg pill
[url=][/url]
Временная регистрация в Санкт-Петербурге: Быстро и Легально!
Ищете, где оформить временную регистрацию в СПБ?
Мы гарантируем быстрое и легальное оформление без очередей и лишних документов.
Ваше спокойствие – наша забота!
Минимум усилий • Максимум удобства • Полная легальность
Свяжитесь с нами прямо сейчас!
Временная регистрация в СПБ
[url=][/url]
https://cytotec.top/# order cytotec online
cost of cheap clomid tablets: can you buy generic clomid pills – buy generic clomid without rx
https://azithromycinus.com/# zithromax online no prescription
cytotec abortion pill [url=https://cytotec.top/#]buy cytotec pills online cheap[/url] Misoprostol 200 mg buy online
https://lisinoprilus.com/# 10 mg lisinopril cost
how much is 30 lisinopril [url=http://lisinoprilus.com/#]zestril 5 mg price[/url] zestril
п»їcytotec pills online: Misoprostol 200 mg buy online – buy cytotec online
cytotec abortion pill [url=http://cytotec.top/#]Misoprostol 200 mg buy online[/url] buy cytotec pills online cheap
https://ciprofloxacin.cheap/# buy ciprofloxacin
cytotec abortion pill [url=http://cytotec.top/#]buy cytotec in usa[/url] purchase cytotec
скачать приложения онлайн казино https://mtcap.com.br/14-luchshih-instrumentov-dlja-razrabotki-mobilnyh/
ordering lisinopril without a prescription uk: lisinopril 10 mg tablets price – lisinopril 10 12.55mg
http://azithromycinus.com/# zithromax buy online no prescription
Abortion pills online [url=http://cytotec.top/#]purchase cytotec[/url] Misoprostol 200 mg buy online
http://azithromycinus.com/# zithromax online usa no prescription
clomid medication [url=https://clomid.store/#]how can i get generic clomid without dr prescription[/url] get cheap clomid
price of zestril 30 mg: lisinopril 2.5 mg for sale – lisinopril 5
can i purchase generic clomid pill [url=http://clomid.store/#]get cheap clomid without insurance[/url] how to buy clomid without rx
вавада официальный сайт вход предоставляет уникальную возможность погрузиться в мир азартных игр. здесь вы сможете создать аккаунт на надёжной платформе vavada. получите доступ к играм через мобильное приложение.
https://azithromycinus.com/# order zithromax without prescription
не упустите возможность! vavada официальный вход — ваш быстрый старт в мире онлайн-развлечений. переходите на зеркало vavada и начните играть прямо сейчас. доступ к казино станет вашим в несколько кликов. удобно на любом устройстве!
buy generic ciprofloxacin: cipro – buy cipro no rx
where to buy clomid prices [url=http://clomid.store/#]where can i get clomid no prescription[/url] can i get generic clomid online
https://azithromycinus.com/# can i buy zithromax over the counter in canada
how to get zithromax online [url=https://azithromycinus.com/#]where can i buy zithromax in canada[/url] zithromax 500mg price
buy ciprofloxacin over the counter: cipro pharmacy – buy cipro online usa
lisinopril 30 mg price: website – lisinopril 10 mg online
cipro ciprofloxacin: buy cipro online without prescription – cipro 500mg best prices
buy ciprofloxacin over the counter [url=https://ciprofloxacin.cheap/#]buy cipro[/url] ciprofloxacin generic
https://lisinoprilus.com/# lisinopril pills
https://lisinoprilus.com/# lisinopril 20 mg india
п»їcipro generic [url=https://ciprofloxacin.cheap/#]buy ciprofloxacin[/url] buy cipro online canada
cytotec abortion pill: п»їcytotec pills online – Misoprostol 200 mg buy online
buy zithromax without prescription online: zithromax pill – zithromax 500 mg
ciprofloxacin order online: antibiotics cipro – ciprofloxacin 500 mg tablet price
cost for 2 mg lisinopril [url=https://lisinoprilus.com/#]lisinopril 60 mg tablet[/url] lisinopril 40mg
buy misoprostol over the counter: buy cytotec – Cytotec 200mcg price
https://cytotec.top/# cytotec online
lisinopril in usa [url=https://lisinoprilus.com/#]lisinopril 20 mg price[/url] zestoretic canada
can i get generic clomid online [url=https://clomid.store/#]buying generic clomid no prescription[/url] how can i get cheap clomid without a prescription
generic zithromax over the counter: buy zithromax no prescription – zithromax without prescription
buy ciprofloxacin over the counter: buy cipro online canada – buy cipro online usa
https://clomid.store/# where buy generic clomid online
cipro ciprofloxacin: buy cipro online – buy cipro online usa
lisinopril otc [url=http://lisinoprilus.com/#]lisinopril 10 mg order online[/url] lisinopril average cost
https://ciprofloxacin.cheap/# buy ciprofloxacin over the counter
cipro: ciprofloxacin generic price – buy cipro online canada
zithromax capsules australia: buy zithromax 1000 mg online – zithromax online pharmacy canada
clomid without prescription: clomid pill – where to buy cheap clomid without rx
buy zithromax [url=http://azithromycinus.com/#]zithromax 500 tablet[/url] where can you buy zithromax
https://azithromycinus.com/# zithromax 500
buy misoprostol over the counter [url=https://cytotec.top/#]purchase cytotec[/url] cytotec abortion pill
zithromax 500mg: buy zithromax without presc – generic zithromax 500mg india
Misoprostol 200 mg buy online: buy cytotec over the counter – Abortion pills online
cipro for sale: buy cipro online without prescription – cipro online no prescription in the usa
http://lisinoprilus.com/# lisinopril 5 mg price
zithromax buy: zithromax coupon – zithromax for sale 500 mg
zithromax online no prescription [url=https://azithromycinus.com/#]zithromax 250 mg pill[/url] zithromax online australia
http://clomid.store/# where can i get clomid now
zestoretic 10 12.5: lisinopril 20 mg price without prescription – buy lisinopril online india
how to get clomid for sale: how to buy cheap clomid without prescription – how to buy cheap clomid now
Предлагаем услуги профессиональных инженеров офицальной мастерской.
Еслли вы искали срочный ремонт телевизоров samsung, можете посмотреть на сайте: срочный ремонт телевизоров samsung
Наши мастера оперативно устранят неисправности вашего устройства в сервисе или с выездом на дом!
lisinopril 2.5 mg price: lisinopril 20 mg price in india – lisinopril 40 mg discount
http://cytotec.top/# buy cytotec over the counter
zestril price in india: lisinopril buy in canada – cost of lisinopril 20 mg
lisinopril 80 mg daily [url=https://lisinoprilus.com/#]buy zestril online[/url] lisinopril metoprolol
https://lisinoprilus.com/# lisinopril tabs 10mg
http://azithromycinus.com/# buy zithromax online with mastercard
buy cytotec pills online cheap [url=https://cytotec.top/#]buy misoprostol over the counter[/url] Misoprostol 200 mg buy online
lisinopril online usa [url=http://lisinoprilus.com/#]rx 535 lisinopril 40 mg[/url] lisinopril 5 mg canada
Секреты игры на Cryptoboss: играйте с
умом актуальное зеркало cryptoboss
п»їcytotec pills online: buy cytotec pills online cheap – buy cytotec online
where can i purchase zithromax online [url=https://azithromycinus.com/#]where can i buy zithromax uk[/url] zithromax buy online
generic zestoretic: lisinopril 200mg – prescription drug prices lisinopril
https://cytotec.top/# buy cytotec over the counter
https://clomid.store/# can i buy cheap clomid tablets
buy cytotec in usa [url=http://cytotec.top/#]buy cytotec in usa[/url] buy cytotec pills
buy zithromax online cheap [url=http://azithromycinus.com/#]zithromax pill[/url] zithromax 250
zestril no prescription: lisinopril 5mg tablets – lisinopril from canada
https://cytotec.top/# buy cytotec over the counter
http://ciprofloxacin.cheap/# ciprofloxacin 500 mg tablet price
zithromax cost [url=https://azithromycinus.com/#]generic zithromax 500mg india[/url] zithromax 250
buy cipro no rx [url=http://ciprofloxacin.cheap/#]ciprofloxacin generic price[/url] buy cipro cheap
Удобный доступ через 1xslots официальный сайт для игры на мобильных устройствах.
ordering lisinopril without a prescription: lisinopril 420 1g – lisinopril 5 mg daily
https://clomid.store/# how to buy clomid without rx
Buy Cenforce 100mg Online: buy cenforce – order cenforce
online ed meds [url=http://edpills.men/#]best online ed treatment[/url] cheapest online ed meds
https://kamagra.men/# п»їkamagra
https://kamagra.men/# Kamagra tablets
https://edpills.men/# boner pills online
sildenafil oral jelly 100mg kamagra: Kamagra Oral Jelly – Kamagra Oral Jelly
https://drugs1st.pro/# drugs1st
buy rybelsus online: semaglutide tablets – semaglutide tablets for weight loss
cheap kamagra [url=https://kamagra.men/#]buy Kamagra[/url] buy Kamagra
http://edpills.men/# cheap erectile dysfunction pills
https://cenforce.icu/# Buy Cenforce 100mg Online
the canadian drugstore: drugs1st – drugs1st
https://cenforce.icu/# cenforce.icu
best online ed medication: ed meds on line – boner pills online
cheapest ed online: online ed medication – online ed medication
http://cenforce.icu/# Purchase Cenforce Online
http://drugs1st.pro/# drugs1st
https://drugs1st.pro/# drugs1st
foods for ed: drugs1st – over the counter erectile dysfunction pills
cost of ed meds: cheap ed medicine – buy ed pills
https://edpills.men/# how to get ed pills
https://kamagra.men/# Kamagra Oral Jelly
Предлагаем услуги профессиональных инженеров офицальной мастерской.
Еслли вы искали ремонт телевизоров hisense, можете посмотреть на сайте: срочный ремонт телевизоров hisense
Наши мастера оперативно устранят неисправности вашего устройства в сервисе или с выездом на дом!
buy Kamagra [url=https://kamagra.men/#]п»їkamagra[/url] Kamagra 100mg price
Cenforce 150 mg online: cheapest cenforce – Cenforce 100mg tablets for sale
http://edpills.men/# online erectile dysfunction
drugs1st: viagra without a doctor prescription – over the counter ed remedies
https://drugs1st.pro/# ed doctor
http://semaglutidetablets.store/# semaglutide tablets store
ed meds online without doctor prescription: vacuum pumps for ed – drugs1st
https://edpills.men/# cheapest ed treatment
Предлагаем услуги профессиональных инженеров офицальной мастерской.
Еслли вы искали срочный ремонт телевизоров hisense, можете посмотреть на сайте: срочный ремонт телевизоров hisense
Наши мастера оперативно устранят неисправности вашего устройства в сервисе или с выездом на дом!
drugs1st: drugs1st – drugs1st
http://cenforce.icu/# cenforce
semaglutide tablets price: semaglutide tablets – buy rybelsus online
drugs1st [url=https://drugs1st.pro/#]best ed medication[/url] drugs1st
Обзор 1xSlots https://aztarna.es/pages/1xslots-casino_15.html
Предлагаем услуги профессиональных инженеров офицальной мастерской.
Еслли вы искали ремонт телевизоров hisense сервис, можете посмотреть на сайте: ремонт телевизоров hisense
Наши мастера оперативно устранят неисправности вашего устройства в сервисе или с выездом на дом!
Cenforce 100mg tablets for sale: cenforce for sale – cenforce
low cost ed pills: erection pills online – discount ed pills
http://cenforce.icu/# buy cenforce
https://edpills.men/# cheap boner pills
http://cenforce.icu/# Purchase Cenforce Online
buy semaglutide: semaglutide tablets – rybelsus semaglutide tablets
cenforce [url=https://cenforce.icu/#]Cenforce 150 mg online[/url] Cenforce 100mg tablets for sale
https://edpills.men/# cheapest erectile dysfunction pills
http://cenforce.icu/# Cenforce 100mg tablets for sale
erectile dysfunction medication online: best online ed pills – ed online pharmacy
https://kamagra.men/# cheap kamagra
https://kamagra.men/# sildenafil oral jelly 100mg kamagra
Получите доступ к любимым играм через 1xslots зеркало на сегодня.
yeni casino siteleri: casinonaxi – yeni deneme bonusu veren siteler 2025
https://slottr.top/# az parayla cok kazandiran slot oyunlar?
http://slottr.top/# en kazancl? slot oyunlar?
en cok kazand?ran slot oyunlar? [url=https://slottr.top/#]slot oyunlar?[/url] slot oyunlar?
https://slottr.top/# az parayla cok kazandiran slot oyunlar?
пинап казино [url=https://pinup2025.com/#]пин ап казино официальный сайт[/url] pinup2025.com
пин ап зеркало: пин ап зеркало – пин ап казино официальный сайт
slot tr online: slot oyunlar? – slot tr online
Производство ангаров и складов под ключ.
Подробная информация и заказ ангаров быстровозводимых
http://slottr.top/# slot siteleri
https://casinositeleri2025.pro/# bahis veren siteler
Предлагаем услуги профессиональных инженеров офицальной мастерской.
Еслли вы искали ремонт телевизоров hisense в москве, можете посмотреть на сайте: срочный ремонт телевизоров hisense
Наши мастера оперативно устранят неисправности вашего устройства в сервисе или с выездом на дом!
casino site: online casino turkey – gore siteler
slot tr online [url=http://slottr.top/#]en cok kazand?ran slot oyunlar?[/url] slot tr online
pinup 2025: пин ап казино зеркало – pinup 2025
pinup2025.com: pinup 2025 – пин ап
https://pinup2025.com/# пин ап
https://casinositeleri2025.pro/# en yeni kaçak bahis siteleri
en cok kazand?ran slot oyunlar?: en cok kazand?ran slot oyunlar? – az parayla cok kazandiran slot oyunlar?
пин ап: пин ап казино зеркало – pinup 2025
Предлагаем услуги профессиональных инженеров офицальной мастерской.
Еслли вы искали срочный ремонт телевизоров hisense, можете посмотреть на сайте: ремонт телевизоров hisense сервис
Наши мастера оперативно устранят неисправности вашего устройства в сервисе или с выездом на дом!
kumar oyunlarД± [url=https://casinositeleri2025.pro/#]yabancД± mekan isimleri[/url] casino bet gГјncel giriЕџ
https://casinositeleri2025.pro/# deneme bonusu veren siteler casino
Подробнее об 1xSlots https://comercialestetica.es/pages/1xslots-casino_17.html
https://casinositeleri2025.pro/# betler
http://slottr.top/# en kazancl? slot oyunlar?
slot oyunlar? puf noktalar? [url=https://slottr.top/#]en kazancl? slot oyunlar?[/url] slot oyunlar?
glГјcksspiel internet: en iyi bahis siteleri 2024 – para bahis gГјncel giriЕџ
slot tr online: az parayla cok kazandiran slot oyunlar? – slot oyunlar? puf noktalar?
Предлагаем услуги профессиональных инженеров офицальной мастерской.
Еслли вы искали ремонт телевизоров hisense, можете посмотреть на сайте: срочный ремонт телевизоров hisense
Наши мастера оперативно устранят неисправности вашего устройства в сервисе или с выездом на дом!
пин ап казино официальный сайт: pinup 2025 – пин ап казино
http://casinositeleri2025.pro/# en yeni deneme bonusu veren siteler 2025
http://pinup2025.com/# pinup 2025
http://pinup2025.com/# пинап казино
pinup 2025: пин ап казино официальный сайт – пин ап вход
пин ап казино: pinup2025.com – пин ап вход
https://slottr.top/# slot siteleri
https://pinup2025.com/# пин ап
пин ап казино официальный сайт: пин ап зеркало – пинап казино
пин ап [url=https://pinup2025.com/#]пин ап казино[/url] пин ап вход
az parayla cok kazandiran slot oyunlar?: en kazancl? slot oyunlar? – en kazancl? slot oyunlar?
http://pinup2025.com/# pinup 2025
http://casinositeleri2025.pro/# yeni Гјyelik bonusu veren siteler
пин ап казино официальный сайт [url=http://pinup2025.com/#]pinup2025.com[/url] пинап казино
пин ап зеркало: пин ап казино зеркало – pinup 2025
https://casinositeleri2025.pro/# en bГјyГјk bahis siteleri
http://pinup2025.com/# пин ап
пин ап [url=https://pinup2025.com/#]pinup 2025[/url] пин ап казино зеркало
пин ап: pinup 2025 – pinup2025.com
https://slottr.top/# en kazancl? slot oyunlar?
https://slottr.top/# en cok kazand?ran slot oyunlar?
пин ап зеркало: пин ап – пин ап казино официальный сайт
katД±lД±m bonusu veren bahis siteleri: hangi bahis siteleri bonus veriyor? – yeni siteler bahis
az parayla cok kazandiran slot oyunlar? [url=https://slottr.top/#]en cok kazand?ran slot oyunlar?[/url] slot oyunlar?
https://casinositeleri2025.pro/# bahis oyun siteleri
slot tr online [url=http://slottr.top/#]slot siteleri[/url] slot oyunlar? puf noktalar?
en kazancl? slot oyunlar?: en cok kazand?ran slot oyunlar? – en cok kazand?ran slot oyunlar?
пин ап вход: пин ап казино официальный сайт – пин ап казино официальный сайт
en kazancl? slot oyunlar?: az parayla cok kazandiran slot oyunlar? – slot tr online
http://pinup2025.com/# пин ап зеркало
http://pinup2025.com/# пин ап зеркало
http://slottr.top/# en kazancl? slot oyunlar?
slot siteleri [url=https://slottr.top/#]slot oyunlar?[/url] slot tr online
slot siteleri [url=http://slottr.top/#]slot siteleri[/url] en cok kazand?ran slot oyunlar?
yasal kumar siteleri: yeni aГ§Д±lan bahis siteleri – en iyi yasal bahis siteleri
Что нового в 1xSlots https://antiguedadeselrodeo.com.ar/pages/1xslots-argentina.html
https://casinositeleri2025.pro/# casino bet giriЕџ
http://slottr.top/# slot tr online
https://casinositeleri2025.pro/# bonus veren yasal bahis siteleri
pinup 2025: pinup2025.com – пин ап вход
guvenilir bahis siteleri: yeni deneme bonusu veren siteler 2025 – slot oyunlarД± isimleri
en kazancl? slot oyunlar? [url=https://slottr.top/#]slot oyunlar? puf noktalar?[/url] en cok kazand?ran slot oyunlar?
http://pinup2025.com/# пин ап вход
http://pinup2025.com/# пин ап казино зеркало
Производство ангаров и складов под ключ.
Подробная информация и заказ быстровозводимый складов
orisbet: bonus veren bahis siteleri yasal – gГјzel siteler
superbetin giriЕџ: yeni bonus veren bahis siteleri – canlД± bahis oyunlarД±
slot siteleri [url=https://slottr.top/#]slot oyunlar?[/url] slot siteleri
http://pinup2025.com/# пин ап казино официальный сайт
https://slottr.top/# en cok kazand?ran slot oyunlar?
http://casinositeleri2025.pro/# pacanele online
pinup2025.com [url=https://pinup2025.com/#]пин ап вход[/url] пинап казино
пин ап казино: пин ап казино – пин ап казино официальный сайт
slot oyunlar?: az parayla cok kazandiran slot oyunlar? – slot siteleri
https://pinup2025.com/# пин ап казино зеркало
https://slottr.top/# en cok kazand?ran slot oyunlar?
http://pinup2025.com/# пин ап зеркало
https://pinup2025.com/# пин ап казино официальный сайт
http://slottr.top/# slot tr online
az parayla cok kazandiran slot oyunlar?: en kazancl? slot oyunlar? – slot oyunlar?
pinup 2025: pinup 2025 – пин ап зеркало
https://pinup2025.com/# пин ап вход
slot siteleri [url=http://slottr.top/#]slot tr online[/url] en kazancl? slot oyunlar?
https://pinup2025.com/# pinup2025.com
пин ап вход: пин ап казино зеркало – пин ап казино зеркало
yeni siteler bahis [url=https://casinositeleri2025.pro/#]deneme bonusu bahis siteleri[/url] deneme bonusu veren bahis siteleri 2025
ed meds online: Best Canadian online pharmacy – online meds for ed
http://mexicanpharmi.com/# buying prescription drugs in mexico
https://indiapharmi.com/# п»їlegitimate online pharmacies india
http://canadianpharmi.com/# male ed
online medication [url=https://canadianpharmi.com/#]Canada Pharmacy[/url] ed natural remedies
ed pills comparison: Best Canadian online pharmacy – erection pills online
https://canadianpharmi.com/# male dysfunction pills
purple pharmacy mexico price list [url=http://mexicanpharmi.com/#]Legit online Mexican pharmacy[/url] pharmacies in mexico that ship to usa
medication from mexico pharmacy: mexican pharmacy – best online pharmacies in mexico
https://canadianpharmi.com/# ed pills online
http://indiapharmi.com/# world pharmacy india
mexican pharmaceuticals online: Purple pharmacy online ordering – mexican rx online
http://mexicanpharmi.com/# reputable mexican pharmacies online
[url=][/url]
DESIGN, FABRICATION & INSTALLATION OF CUSTOM MADE LOUVERS!
DK Construction & Design provides comprehensive, custom solutions for louvres,
sunshades, privacy screens, awnings, and balustrades made from aluminium, glass, and steel.
Our end-to-end service covers on-site measurements, design development, detailed drawings,
engineering, fabrication, and installation.
We work closely with designers, architects, and homeowners to deliver tailored shading,
privacy, and safety solutions. Our team ensures that every project meets the highest
standards of quality and durability, with a focus on functionality and aesthetics.
Whether you’re after sleek sun control systems or secure balustrading, we’ve got
the expertise to bring your vision to life.
Tel: +61475 617 720
Сайт компании DK Construction & Design
[url=][/url]
mexican rx online: mexicanpharmi – mexican border pharmacies shipping to usa
https://mexicanpharmi.com/# mexican mail order pharmacies
https://mexicanpharmi.com/# best online pharmacies in mexico
https://indiapharmi.com/# indian pharmacy
Unete a 1xslots https://nodosde.gob.ar/pgs/1xslots-descargar_1.html
cheapest ed pills online [url=http://canadianpharmi.com/#]Canadian pharmacy prices[/url] canadian drugs
http://mexicanpharmi.com/# purple pharmacy mexico price list
https://mexicanpharmi.com/# mexican rx online
http://mexicanpharmi.com/# purple pharmacy mexico price list
reputable indian pharmacies: Indian pharmacy international shipping – indian pharmacy paypal
mexico drug stores pharmacies: mexicanpharmi – mexican rx online
http://indiapharmi.com/# cheapest online pharmacy india
cheap medication online: canadianpharmi – top erection pills
online ed drugs [url=https://canadianpharmi.com/#]canadian pharmacy[/url] cheapest ed pills
https://canadianpharmi.com/# natural ed treatment
online drugs: canadian pharmacy – ed medications online
https://mexicanpharmi.com/# mexican mail order pharmacies
erection pills online: Best Canadian pharmacy – erectile dysfunction cure
https://mexicanpharmi.com/# mexican rx online
https://indiapharmi.com/# indianpharmacy com
http://indiapharmi.com/# reputable indian online pharmacy
Krijg de CorgiSlot APK https://www.azoren.nl/pag/corgislot-casino.html
reputable indian online pharmacy: indian pharmacy – top online pharmacy india
mexican online pharmacies prescription drugs [url=http://mexicanpharmi.com/#]Online Mexican pharmacy[/url] mexican drugstore online
india pharmacy mail order: Best Indian pharmacy – indianpharmacy com
https://canadianpharmi.com/# ed vacuum pumps
http://canadianpharmi.com/# ed in men
http://mexicanpharmi.com/# п»їbest mexican online pharmacies
ed drugs compared: canadianpharmi – online canadian pharmacy
ed meds online without doctor prescription [url=https://canadianpharmi.com/#]canadian pharmacy[/url] treat ed
https://canadianpharmi.com/# online medications
indian pharmacy: indian pharmacy – best india pharmacy
buying from online mexican pharmacy [url=http://mexicanpharmi.com/#]Online pharmacy[/url] mexico pharmacies prescription drugs
world pharmacy india: India online pharmacy international shipping – cheapest online pharmacy india
http://mexicanpharmi.com/# mexican drugstore online
https://indiapharmi.com/# top 10 pharmacies in india
http://indiapharmi.com/# Online medicine order
drugs prices: Canada Pharmacy – buy cheap prescription drugs online
top 10 pharmacies in india: India online pharmacy international shipping – buy prescription drugs from india
http://mexicanpharmi.com/# mexican border pharmacies shipping to usa
https://mexicanpharmi.com/# reputable mexican pharmacies online
https://canadianpharmi.com/# ed drug comparison
mexican pharmaceuticals online [url=https://mexicanpharmi.com/#]mexicanpharmi[/url] buying from online mexican pharmacy
https://indiapharmi.com/# cheapest online pharmacy india
buy medicines online in india: India pharmacy international – top online pharmacy india
Предлагаем услуги профессиональных инженеров офицальной мастерской.
Еслли вы искали ремонт телевизоров haier, можете посмотреть на сайте: ремонт телевизоров haier адреса
Наши мастера оперативно устранят неисправности вашего устройства в сервисе или с выездом на дом!
https://canadianpharmi.com/# generic ed pills
https://indiapharmi.com/# buy prescription drugs from india
http://indiapharmi.com/# mail order pharmacy india
buy ed drugs online: Best Canadian online pharmacy – male dysfunction
Предлагаем услуги профессиональных инженеров офицальной мастерской.
Еслли вы искали ремонт телевизоров lg рядом, можете посмотреть на сайте: ремонт телевизоров lg адреса
Наши мастера оперативно устранят неисправности вашего устройства в сервисе или с выездом на дом!
cheapest online pharmacy india [url=http://indiapharmi.com/#]Online medicine home delivery[/url] india pharmacy mail order
Предлагаем услуги профессиональных инженеров офицальной мастерской.
Еслли вы искали ремонт телефонов xiaomi цены, можете посмотреть на сайте: срочный ремонт телефонов xiaomi
Наши мастера оперативно устранят неисправности вашего устройства в сервисе или с выездом на дом!
buy prescription drugs online: Canada Pharmacy – sildenafil without a doctor’s prescription
https://mexicanpharmi.com/# mexican mail order pharmacies
order prednisone with mastercard debit: Predni Best – buy prednisone nz
https://amoxstar.com/# how to buy amoxicillin online
https://prednibest.com/# prednisone 20 mg in india
https://prednibest.com/# prednisone 50 mg prices
prednisone 200 mg tablets [url=https://prednibest.com/#]prednisone where can i buy[/url] prednisone acetate
how to get generic clomid without dr prescription: where to buy clomid without prescription – where can i buy clomid pills
buy cipro online usa [url=https://cipharmdelivery.com/#]cipro[/url] buy cipro no rx
https://clomidonpharm.com/# get cheap clomid online
buy cipro online usa: CiPharmDelivery – buy ciprofloxacin
Предлагаем услуги профессиональных инженеров офицальной мастерской.
Еслли вы искали ремонт телефонов vivo цены, можете посмотреть на сайте: ремонт телефонов vivo цены
Наши мастера оперативно устранят неисправности вашего устройства в сервисе или с выездом на дом!
Предлагаем услуги профессиональных инженеров офицальной мастерской.
Еслли вы искали ремонт телефонов realme, можете посмотреть на сайте: ремонт телефонов realme в москве
Наши мастера оперативно устранят неисправности вашего устройства в сервисе или с выездом на дом!
Предлагаем услуги профессиональных инженеров офицальной мастерской.
Еслли вы искали ремонт телефонов sony рядом, можете посмотреть на сайте: ремонт телефонов sony цены
Наши мастера оперативно устранят неисправности вашего устройства в сервисе или с выездом на дом!
http://clomidonpharm.com/# where to buy generic clomid no prescription
http://cipharmdelivery.com/# where to buy cipro online
https://cipharmdelivery.com/# buy cipro without rx
buy amoxicillin 500mg online: AmoxStar – can you buy amoxicillin over the counter
https://amoxstar.com/# buying amoxicillin online
order amoxicillin online [url=http://amoxstar.com/#]AmoxStar[/url] can you buy amoxicillin uk
http://clomidonpharm.com/# where to get generic clomid pill
п»їcipro generic: cipro for sale – ciprofloxacin 500 mg tablet price
can i buy amoxicillin over the counter in australia [url=https://amoxstar.com/#]AmoxStar[/url] buy amoxil
Ga naar het online CorgiSlot casino https://welling.domains.unf.edu/member.php?action=profile&uid=4198
https://clomidonpharm.com/# clomid without a prescription
buy amoxicillin online uk [url=http://amoxstar.com/#]amoxicillin medicine over the counter[/url] medicine amoxicillin 500
buy generic ciprofloxacin: buy cipro no rx – where to buy cipro online
ciprofloxacin generic price: CiPharmDelivery – buy cipro online without prescription
http://amoxstar.com/# buy amoxicillin
http://clomidonpharm.com/# where can i buy generic clomid without prescription
http://amoxstar.com/# amoxicillin 500 mg purchase without prescription
cipro pharmacy [url=http://cipharmdelivery.com/#]buy generic ciprofloxacin[/url] ciprofloxacin generic price
http://amoxstar.com/# how much is amoxicillin
cheap prednisone 20 mg: prednisone prescription drug – prednisone 10 mg online
order cheap clomid without rx [url=https://clomidonpharm.com/#]clomid on pharm[/url] where can i buy clomid
http://clomidonpharm.com/# can i get clomid without rx
prednisone 1 mg for sale: 40 mg daily prednisone – prednisone 10 mg online
рубли в тенге [url=https://converter-valut.kz/]конвертер валют[/url] .
Платформа предлагает простой интерфейс и бесплатную конвертацию валют. Будь то тенге, рубли или юани – все расчеты происходят моментально с использованием актуальных данных.
amoxicillin 500mg capsules price: amoxicillin 500 capsule – amoxicillin 775 mg
http://prednibest.com/# generic prednisone cost
over the counter amoxicillin: Amox Star – azithromycin amoxicillin
ciprofloxacin order online [url=https://cipharmdelivery.com/#]ciprofloxacin mail online[/url] ciprofloxacin mail online
https://cipharmdelivery.com/# ciprofloxacin 500 mg tablet price
how to get cheap clomid price: can i purchase generic clomid – generic clomid without rx
amoxicillin 500mg capsule cost: Amox Star – amoxicillin 500 mg purchase without prescription
http://cipharmdelivery.com/# ciprofloxacin 500 mg tablet price
buy amoxicillin 500mg online [url=https://amoxstar.com/#]Amox Star[/url] amoxicillin 500 mg
order generic clomid tablets: clomidonpharm – where to get clomid without insurance
where can i buy generic clomid now [url=http://clomidonpharm.com/#]can i purchase cheap clomid prices[/url] can you buy generic clomid without a prescription
Здесь можно оружейный сейф в москвеоружейные сейфы и шкафы
Предлагаем услуги профессиональных инженеров офицальной мастерской.
Еслли вы искали ремонт телефонов nothing, можете посмотреть на сайте: срочный ремонт телефонов nothing
Наши мастера оперативно устранят неисправности вашего устройства в сервисе или с выездом на дом!
Предлагаем услуги профессиональных инженеров офицальной мастерской.
Еслли вы искали ремонт телефонов samsung рядом, можете посмотреть на сайте: ремонт телефонов samsung сервис
Наши мастера оперативно устранят неисправности вашего устройства в сервисе или с выездом на дом!
https://prednibest.com/# prednisone 80 mg daily
order clomid pills: clomidonpharm – how to buy generic clomid without rx
http://clomidonpharm.com/# can i buy generic clomid without rx
amoxicillin 500mg pill [url=https://amoxstar.com/#]buy amoxicillin canada[/url] cheap amoxicillin 500mg
how much is amoxicillin prescription: Amox Star – amoxicillin 1000 mg capsule
prednisone buy without prescription [url=https://prednibest.com/#]prednisone buy cheap[/url] prednisone generic cost
Здесь можно сейф купить домашний сейф купить
Предлагаем услуги профессиональных инженеров офицальной мастерской.
Еслли вы искали ремонт телефонов poco рядом, можете посмотреть на сайте: ремонт телефонов poco цены
Наши мастера оперативно устранят неисправности вашего устройства в сервисе или с выездом на дом!
https://clomidonpharm.com/# get clomid without rx
Предлагаем услуги профессиональных инженеров офицальной мастерской.
Еслли вы искали ремонт телефонов meizu сервис, можете посмотреть на сайте: ремонт телефонов meizu
Наши мастера оперативно устранят неисправности вашего устройства в сервисе или с выездом на дом!
buy amoxicillin 500mg usa: AmoxStar – amoxicillin 500mg pill
buy amoxicillin 500mg usa: buy amoxicillin 500mg – amoxicillin 250 mg
http://prednibest.com/# 2.5 mg prednisone daily
where can i buy amoxicillin online: Amox Star – amoxicillin pills 500 mg
amoxicillin buy no prescription [url=https://amoxstar.com/#]amoxicillin 500 tablet[/url] amoxicillin 500 mg tablet price
https://cipharmdelivery.com/# ciprofloxacin over the counter
Предлагаем услуги профессиональных инженеров офицальной мастерской.
Еслли вы искали ремонт телефонов infinix в москве, можете посмотреть на сайте: срочный ремонт телефонов infinix
Наши мастера оперативно устранят неисправности вашего устройства в сервисе или с выездом на дом!
Предлагаем услуги профессиональных инженеров офицальной мастерской.
Еслли вы искали ремонт телефонов honor в москве, можете посмотреть на сайте: ремонт телефонов honor рядом
Наши мастера оперативно устранят неисправности вашего устройства в сервисе или с выездом на дом!
buy generic prednisone online: where to buy prednisone 20mg – prednisone 10 mg tablets
Здесь можно домашний сейф цена купить сейф домой
where can i buy cipro online: buy ciprofloxacin – ciprofloxacin order online
http://prednibest.com/# purchase prednisone canada
ciprofloxacin mail online [url=http://cipharmdelivery.com/#]ciprofloxacin order online[/url] ciprofloxacin generic
azithromycin amoxicillin [url=http://amoxstar.com/#]Amox Star[/url] buy amoxicillin online with paypal
ciprofloxacin: cipro 500mg best prices – buy cipro online without prescription
Тут можно преобрести сейф взломостойкий купить взломостойкие сейфы
https://amoxstar.com/# amoxicillin 250 mg price in india
amoxicillin 250 mg: Amox Star – buy cheap amoxicillin online
http://cipharmdelivery.com/# ciprofloxacin mail online
Предлагаем услуги профессиональных инженеров офицальной мастерской.
Еслли вы искали ремонт стиральных машин zanussi сервис, можете посмотреть на сайте: срочный ремонт стиральных машин zanussi
Наши мастера оперативно устранят неисправности вашего устройства в сервисе или с выездом на дом!
where buy clomid without dr prescription [url=http://clomidonpharm.com/#]can i get generic clomid prices[/url] can i buy clomid without rx
how can i get generic clomid for sale: clomidonpharm – get clomid online
azithromycin amoxicillin: where to buy amoxicillin 500mg – where to buy amoxicillin
order prednisone on line [url=http://prednibest.com/#]buy prednisone without prescription paypal[/url] online prednisone 5mg
https://cipharmdelivery.com/# buy ciprofloxacin over the counter
http://prednibest.com/# prednisone uk
buy amoxicillin 500mg usa: Amox Star – buying amoxicillin online
ciprofloxacin: ciprofloxacin order online – cipro for sale
buy amoxicillin without prescription [url=https://amoxstar.com/#]amoxicillin 500mg price[/url] buy amoxicillin over the counter uk
can i order generic clomid for sale: clomid on pharm – where can i buy clomid without rx
can i get generic clomid [url=https://clomidonpharm.com/#]clomid on pharm[/url] can you get generic clomid online
http://cipharmdelivery.com/# п»їcipro generic
Предлагаем услуги профессиональных инженеров офицальной мастерской.
Еслли вы искали срочный ремонт стиральных машин siemens, можете посмотреть на сайте: ремонт стиральных машин siemens рядом
Наши мастера оперативно устранят неисправности вашего устройства в сервисе или с выездом на дом!
buy cipro online without prescription: CiPharmDelivery – ciprofloxacin
http://amoxstar.com/# amoxicillin 800 mg price
buy cipro online canada: antibiotics cipro – ciprofloxacin 500mg buy online
Предлагаем услуги профессиональных инженеров офицальной мастерской.
Еслли вы искали ремонт стиральных машин smeg адреса, можете посмотреть на сайте: ремонт стиральных машин smeg
Наши мастера оперативно устранят неисправности вашего устройства в сервисе или с выездом на дом!
prednisone otc uk [url=http://prednibest.com/#]PredniBest[/url] over the counter prednisone cream
cost generic clomid without insurance: clomidonpharm – cost of clomid prices
https://prednibest.com/# prednisone over the counter cost
http://prednibest.com/# prednisone daily use
where to get generic clomid without rx: cost cheap clomid without dr prescription – how can i get clomid tablets
where buy cheap clomid without prescription: clomidonpharm – buying generic clomid without prescription
prednisone 10 mg [url=http://prednibest.com/#]Predni Best[/url] generic prednisone online
buying clomid tablets: can i get generic clomid without insurance – where to buy clomid without a prescription
Предлагаем услуги профессиональных инженеров офицальной мастерской.
Еслли вы искали ремонт стиральных машин indesit рядом, можете посмотреть на сайте: ремонт стиральных машин indesit сервис
Наши мастера оперативно устранят неисправности вашего устройства в сервисе или с выездом на дом!
Предлагаем услуги профессиональных инженеров офицальной мастерской.
Еслли вы искали срочный ремонт стиральных машин lg, можете посмотреть на сайте: срочный ремонт стиральных машин lg
Наши мастера оперативно устранят неисправности вашего устройства в сервисе или с выездом на дом!
http://prednibest.com/# prednisone online paypal
how to buy generic clomid no prescription: generic clomid without dr prescription – buy cheap clomid price
http://clomidonpharm.com/# can you get cheap clomid
buy cipro without rx: buy cipro online – cipro for sale
where can i get generic clomid without prescription [url=https://clomidonpharm.com/#]order cheap clomid without a prescription[/url] how can i get generic clomid without dr prescription
Предлагаем услуги профессиональных инженеров офицальной мастерской.
Еслли вы искали ремонт стиральных машин kuppersbusch сервис, можете посмотреть на сайте: ремонт стиральных машин kuppersbusch
Наши мастера оперативно устранят неисправности вашего устройства в сервисе или с выездом на дом!
https://prednibest.com/# how to buy prednisone online
buy cipro online usa: ciprofloxacin over the counter – cipro pharmacy
https://prednibest.com/# over the counter prednisone pills
Предлагаем услуги профессиональных инженеров офицальной мастерской.
Еслли вы искали ремонт приставок xbox цены, можете посмотреть на сайте: ремонт приставок xbox в москве
Наши мастера оперативно устранят неисправности вашего устройства в сервисе или с выездом на дом!
Предлагаем услуги профессиональных инженеров офицальной мастерской.
Еслли вы искали срочный ремонт стиральных машин aeg, можете посмотреть на сайте: срочный ремонт стиральных машин aeg
Наши мастера оперативно устранят неисправности вашего устройства в сервисе или с выездом на дом!
Предлагаем услуги профессиональных инженеров офицальной мастерской.
Еслли вы искали ремонт посудомоечных машин siemens цены, можете посмотреть на сайте: ремонт посудомоечных машин siemens в москве
Наши мастера оперативно устранят неисправности вашего устройства в сервисе или с выездом на дом!
Предлагаем услуги профессиональных инженеров офицальной мастерской.
Еслли вы искали ремонт приставок sony playstation рядом, можете посмотреть на сайте: ремонт приставок sony playstation рядом
Наши мастера оперативно устранят неисправности вашего устройства в сервисе или с выездом на дом!
Предлагаем услуги профессиональных инженеров офицальной мастерской.
Еслли вы искали ремонт посудомоечных машин miele, можете посмотреть на сайте: ремонт посудомоечных машин miele сервис
Наши мастера оперативно устранят неисправности вашего устройства в сервисе или с выездом на дом!
Предлагаем услуги профессиональных инженеров офицальной мастерской.
Еслли вы искали ремонт стиральных машин dexp цены, можете посмотреть на сайте: ремонт стиральных машин dexp сервис
Наши мастера оперативно устранят неисправности вашего устройства в сервисе или с выездом на дом!
Предлагаем услуги профессиональных инженеров офицальной мастерской.
Еслли вы искали ремонт посудомоечных машин beko цены, можете посмотреть на сайте: ремонт посудомоечных машин beko адреса
Наши мастера оперативно устранят неисправности вашего устройства в сервисе или с выездом на дом!
Предлагаем услуги профессиональных инженеров офицальной мастерской.
Еслли вы искали срочный ремонт посудомоечных машин midea, можете посмотреть на сайте: ремонт посудомоечных машин midea сервис
Наши мастера оперативно устранят неисправности вашего устройства в сервисе или с выездом на дом!
Предлагаем услуги профессиональных инженеров офицальной мастерской.
Еслли вы искали ремонт посудомоечных машин hotpoint ariston сервис, можете посмотреть на сайте: ремонт посудомоечных машин hotpoint ariston
Наши мастера оперативно устранят неисправности вашего устройства в сервисе или с выездом на дом!
Предлагаем услуги профессиональных инженеров офицальной мастерской.
Еслли вы искали ремонт посудомоечных машин aeg рядом, можете посмотреть на сайте: срочный ремонт посудомоечных машин aeg
Наши мастера оперативно устранят неисправности вашего устройства в сервисе или с выездом на дом!
pinup 2025: gramster – pinup 2025
https://gramster.ru/# pinup 2025
http://gramster.ru/# пин ап
http://gramster.ru/# пин ап
https://gramster.ru/# pinup 2025
пин ап казино зеркало [url=https://gramster.ru/#]gramster.ru[/url] пинап казино
https://gramster.ru/# gramster.ru
пинап казино: gramster.ru – пин ап вход
https://gramster.ru/# пин ап вход
http://gramster.ru/# pinup 2025
https://gramster.ru/# пин ап казино
https://gramster.ru/# пин ап
https://gramster.ru/# пин ап казино официальный сайт
gramster.ru [url=https://gramster.ru/#]Gramster[/url] пин ап казино официальный сайт
https://gramster.ru/# пин ап казино официальный сайт
https://gramster.ru/# пин ап казино
pinup 2025: gramster.ru – gramster.ru
http://gramster.ru/# пин ап зеркало
Can you be more specific about the content of your article? After reading it, I still have some doubts. Hope you can help me.
http://gramster.ru/# pinup 2025
https://gramster.ru/# pinup 2025
pinup 2025 [url=http://gramster.ru/#]gramster[/url] pinup 2025
http://gramster.ru/# pinup 2025
https://gramster.ru/# пин ап вход
gramster.ru [url=http://gramster.ru/#]gramster[/url] пин ап казино
https://gramster.ru/# пин ап казино
пин ап зеркало: Gramster – pinup 2025
http://gramster.ru/# pinup 2025
http://gramster.ru/# пинап казино
pinup 2025 [url=http://gramster.ru/#]Gramster[/url] пин ап казино
пин ап вход: gramster – gramster.ru
https://gramster.ru/# пинап казино
http://gramster.ru/# pinup 2025
http://gramster.ru/# пин ап зеркало
пин ап казино [url=https://gramster.ru/#]Gramster[/url] пин ап казино
https://gramster.ru/# пин ап казино
пин ап казино официальный сайт: Gramster – пинап казино
http://gramster.ru/# пин ап казино официальный сайт
пин ап вход [url=http://gramster.ru/#]gramster[/url] pinup 2025
https://gramster.ru/# пин ап казино зеркало
https://gramster.ru/# пин ап
https://gramster.ru/# пин ап
https://gramster.ru/# пинап казино
https://gramster.ru/# пин ап казино официальный сайт
https://gramster.ru/# пин ап
https://gramster.ru/# пин ап казино официальный сайт
pinup 2025: gramster – пин ап казино зеркало
Предлагаем услуги профессиональных инженеров офицальной мастерской.
Еслли вы искали ремонт ноутбуков sony, можете посмотреть на сайте: срочный ремонт ноутбуков sony
Наши мастера оперативно устранят неисправности вашего устройства в сервисе или с выездом на дом!
http://gramster.ru/# пин ап казино
https://gramster.ru/# пин ап казино зеркало
пинап казино [url=http://gramster.ru/#]gramster.ru[/url] пин ап казино зеркало
пин ап казино официальный сайт: gramster.ru – пин ап
https://gramster.ru/# пин ап
https://gramster.ru/# пин ап
https://gramster.ru/# pinup 2025
https://gramster.ru/# пин ап казино зеркало
pinup 2025: gramster – пин ап казино официальный сайт
https://gramster.ru/# пин ап казино официальный сайт
https://gramster.ru/# пин ап зеркало
пин ап: gramster – пин ап вход
https://gramster.ru/# пин ап казино
пин ап казино зеркало [url=http://gramster.ru/#]Gramster[/url] пин ап казино официальный сайт
http://gramster.ru/# пин ап казино зеркало
pinup 2025: Gramster – gramster.ru
http://gramster.ru/# пин ап
https://gramster.ru/# pinup 2025
gramster.ru: Gramster – пин ап зеркало
https://gramster.ru/# пин ап казино зеркало
https://gramster.ru/# gramster.ru
https://gramster.ru/# пин ап зеркало
пин ап казино зеркало [url=https://gramster.ru/#]gramster.ru[/url] пин ап казино зеркало
https://gramster.ru/# pinup 2025
pinup 2025: Gramster – пин ап казино официальный сайт
Предлагаем услуги профессиональных инженеров офицальной мастерской.
Еслли вы искали ремонт ноутбуков msi сервис, можете посмотреть на сайте: ремонт ноутбуков msi адреса
Наши мастера оперативно устранят неисправности вашего устройства в сервисе или с выездом на дом!
http://gramster.ru/# pinup 2025
https://gramster.ru/# пинап казино
pinup 2025 [url=https://gramster.ru/#]Gramster[/url] пин ап казино официальный сайт
пин ап казино официальный сайт: gramster.ru – pinup 2025
http://gramster.ru/# пин ап зеркало
canada drugs reviews: best online canadian pharmacy – certified canadian international pharmacy
buy medicines online in india [url=http://indianpharmacy.win/#]india pharmacy[/url] top 10 pharmacies in india
http://mexicanpharmacy.store/# mexico drug stores pharmacies
https://canadianpharmacy.win/# canadian pharmacies compare
canadian pharmacy prices: best canadian pharmacy – legit canadian online pharmacy
https://indianpharmacy.win/# top online pharmacy india
http://canadianpharmacy.win/# certified canadian international pharmacy
Предлагаем услуги профессиональных инженеров офицальной мастерской.
Еслли вы искали ремонт ноутбуков toshiba рядом, можете посмотреть на сайте: ремонт ноутбуков toshiba адреса
Наши мастера оперативно устранят неисправности вашего устройства в сервисе или с выездом на дом!
Предлагаем услуги профессиональных инженеров офицальной мастерской.
Еслли вы искали ремонт ноутбуков fujitsu siemens адреса, можете посмотреть на сайте: ремонт ноутбуков fujitsu siemens
Наши мастера оперативно устранят неисправности вашего устройства в сервисе или с выездом на дом!
reputable mexican pharmacies online [url=https://mexicanpharmacy.store/#]buying from online mexican pharmacy[/url] pharmacies in mexico that ship to usa
Предлагаем услуги профессиональных инженеров офицальной мастерской.
Еслли вы искали ремонт ноутбуков toshiba адреса, можете посмотреть на сайте: ремонт ноутбуков toshiba
Наши мастера оперативно устранят неисправности вашего устройства в сервисе или с выездом на дом!
http://canadianpharmacy.win/# cheapest pharmacy canada
http://mexicanpharmacy.store/# mexico pharmacies prescription drugs
http://indianpharmacy.win/# buy prescription drugs from india
medication from mexico pharmacy: purple pharmacy mexico price list – mexico drug stores pharmacies
Предлагаем услуги профессиональных инженеров офицальной мастерской.
Еслли вы искали ремонт ноутбуков fujitsu siemens рядом, можете посмотреть на сайте: срочный ремонт ноутбуков fujitsu siemens
Наши мастера оперативно устранят неисправности вашего устройства в сервисе или с выездом на дом!
best india pharmacy: mail order pharmacy india – best online pharmacy india
http://indianpharmacy.win/# п»їlegitimate online pharmacies india
http://mexicanpharmacy.store/# buying prescription drugs in mexico
pharmacies in mexico that ship to usa [url=http://mexicanpharmacy.store/#]buying prescription drugs in mexico[/url] mexican mail order pharmacies
https://indianpharmacy.win/# india pharmacy
http://mexicanpharmacy.store/# pharmacies in mexico that ship to usa
https://mexicanpharmacy.store/# buying from online mexican pharmacy
canada pharmacy online: canadian pharmacy win – safe reliable canadian pharmacy
п»їbest mexican online pharmacies [url=https://mexicanpharmacy.store/#]mexican border pharmacies shipping to usa[/url] mexico drug stores pharmacies
https://mexicanpharmacy.store/# buying from online mexican pharmacy
https://mexicanpharmacy.store/# mexican border pharmacies shipping to usa
buying from canadian pharmacies: best canadian online pharmacy – canadian 24 hour pharmacy
https://mexicanpharmacy.store/# mexico drug stores pharmacies
http://indianpharmacy.win/# top 10 pharmacies in india
https://indianpharmacy.win/# indianpharmacy com
http://canadianpharmacy.win/# canadian pharmacy ratings
https://canadianpharmacy.win/# canadian pharmacy no rx needed
canadian pharmacy king [url=http://canadianpharmacy.win/#]best online canadian pharmacy[/url] canada pharmacy reviews
best india pharmacy: top 10 online pharmacy in india – india online pharmacy
http://indianpharmacy.win/# reputable indian online pharmacy
https://mexicanpharmacy.store/# reputable mexican pharmacies online
online canadian pharmacy: canadian pharmacy win – canadian pharmacy sarasota
http://mexicanpharmacy.store/# medicine in mexico pharmacies
http://mexicanpharmacy.store/# medication from mexico pharmacy
https://canadianpharmacy.win/# canada drugs
п»їbest mexican online pharmacies [url=https://mexicanpharmacy.store/#]mexico pharmacies prescription drugs[/url] medicine in mexico pharmacies
https://indianpharmacy.win/# top 10 pharmacies in india
cheapest online pharmacy india: indian pharmacy online – reputable indian pharmacies
https://mexicanpharmacy.store/# purple pharmacy mexico price list
https://indianpharmacy.win/# indian pharmacy online
http://canadianpharmacy.win/# canada pharmacy
online canadian pharmacy reviews [url=https://canadianpharmacy.win/#]best online canadian pharmacy[/url] pharmacy wholesalers canada
http://canadianpharmacy.win/# canada drug pharmacy
https://indianpharmacy.win/# indian pharmacy paypal
http://indianpharmacy.win/# indian pharmacy paypal
https://canadianpharmacy.win/# canadian pharmacy 365
https://canadianpharmacy.win/# canadian pharmacy uk delivery
reputable mexican pharmacies online: buying prescription drugs in mexico online – mexican rx online
http://mexicanpharmacy.store/# buying from online mexican pharmacy
http://mexicanpharmacy.store/# mexico pharmacies prescription drugs
mexican online pharmacies prescription drugs: mexico drug stores pharmacies – medication from mexico pharmacy
http://canadianpharmacy.win/# canada drugs reviews
http://mexicanpharmacy.store/# mexico drug stores pharmacies
mexico drug stores pharmacies [url=http://mexicanpharmacy.store/#]mexican border pharmacies shipping to usa[/url] buying prescription drugs in mexico
http://mexicanpharmacy.store/# best online pharmacies in mexico
top 10 online pharmacy in india: Online medicine home delivery – indian pharmacy paypal
https://canadianpharmacy.win/# legitimate canadian pharmacy online
http://indianpharmacy.win/# Online medicine order
https://canadianpharmacy.win/# my canadian pharmacy
http://canadianpharmacy.win/# canadian pharmacies online
http://indianpharmacy.win/# mail order pharmacy india
world pharmacy india: best india pharmacy – п»їlegitimate online pharmacies india
reputable indian online pharmacy [url=https://indianpharmacy.win/#]india pharmacy mail order[/url] mail order pharmacy india
https://canadianpharmacy.win/# www canadianonlinepharmacy
https://mexicanpharmacy.store/# п»їbest mexican online pharmacies
https://mexicanpharmacy.store/# reputable mexican pharmacies online
http://canadianpharmacy.win/# canada pharmacy online
vipps canadian pharmacy [url=http://canadianpharmacy.win/#]best canadian online pharmacy[/url] best canadian pharmacy
https://mexicanpharmacy.store/# buying prescription drugs in mexico online
http://indianpharmacy.win/# mail order pharmacy india
http://indianpharmacy.win/# top online pharmacy india
http://canadianpharmacy.win/# canadian online drugs
online pharmacy canada: best canadian online pharmacy – pharmacy canadian superstore
https://mexicanpharmacy.store/# buying prescription drugs in mexico online
onlinepharmaciescanada com [url=http://canadianpharmacy.win/#]best canadian online pharmacy[/url] prescription drugs canada buy online
https://mexicanpharmacy.store/# mexican border pharmacies shipping to usa
https://mexicanpharmacy.store/# medicine in mexico pharmacies
mexican border pharmacies shipping to usa: best online pharmacies in mexico – п»їbest mexican online pharmacies
https://canadianpharmacy.win/# legitimate canadian online pharmacies
https://mexicanpharmacy.store/# mexican border pharmacies shipping to usa
mexican drugstore online: mexico drug stores pharmacies – buying prescription drugs in mexico
http://indianpharmacy.win/# world pharmacy india
https://canadianpharmacy.win/# canadian pharmacy
п»їbest mexican online pharmacies [url=https://mexicanpharmacy.store/#]purple pharmacy mexico price list[/url] best online pharmacies in mexico
https://mexicanpharmacy.store/# mexico drug stores pharmacies
п»їlegitimate online pharmacies india: indian pharmacy online – Online medicine home delivery
http://canadianpharmacy.win/# best rated canadian pharmacy
http://mexicanpharmacy.store/# mexico pharmacies prescription drugs
https://mexicanpharmacy.store/# purple pharmacy mexico price list
https://mexicanpharmacy.store/# pharmacies in mexico that ship to usa
https://canadianpharmacy.win/# canadian drugstore online
canada pharmacy reviews [url=https://canadianpharmacy.win/#]canadian pharmacy no scripts[/url] canadian online drugstore
legit canadian online pharmacy: canadian pharmacy win – canadian pharmacy phone number
https://canadianpharmacy.win/# cross border pharmacy canada
http://canadianpharmacy.win/# best canadian online pharmacy
escrow pharmacy canada [url=http://canadianpharmacy.win/#]best online canadian pharmacy[/url] canadian pharmacy 365
reputable canadian online pharmacies: canadian pharmacy 24 – canada ed drugs
https://canadianpharmacy.win/# canadian world pharmacy
http://canadianpharmacy.win/# certified canadian international pharmacy
https://canadianpharmacy.win/# legit canadian pharmacy online
http://indianpharmacy.win/# п»їlegitimate online pharmacies india
http://mexicanpharmacy.store/# mexican rx online
Предлагаем услуги профессиональных инженеров офицальной мастерской.
Еслли вы искали ремонт ноутбуков toshiba рядом, можете посмотреть на сайте: ремонт ноутбуков toshiba
Наши мастера оперативно устранят неисправности вашего устройства в сервисе или с выездом на дом!
https://canadianpharmacy.win/# trustworthy canadian pharmacy
canadian pharmacy meds reviews [url=http://canadianpharmacy.win/#]best canadian online pharmacy[/url] canada drug pharmacy
Предлагаем услуги профессиональных инженеров офицальной мастерской.
Еслли вы искали срочный ремонт ноутбуков toshiba, можете посмотреть на сайте: ремонт ноутбуков toshiba рядом
Наши мастера оперативно устранят неисправности вашего устройства в сервисе или с выездом на дом!
Предлагаем услуги профессиональных инженеров офицальной мастерской.
Еслли вы искали ремонт ноутбуков fujitsu siemens адреса, можете посмотреть на сайте: ремонт ноутбуков fujitsu siemens
Наши мастера оперативно устранят неисправности вашего устройства в сервисе или с выездом на дом!
canadian drug prices: best canadian online pharmacy – onlinecanadianpharmacy
https://mexicanpharmacy.store/# mexican pharmaceuticals online
https://canadianpharmacy.win/# canadian pharmacy world
https://mexicanpharmacy.store/# mexican rx online
cheapest online pharmacy india [url=http://indianpharmacy.win/#]best india pharmacy[/url] top online pharmacy india
Предлагаем услуги профессиональных инженеров офицальной мастерской.
Еслли вы искали ремонт ноутбуков fujitsu siemens в москве, можете посмотреть на сайте: ремонт ноутбуков fujitsu siemens
Наши мастера оперативно устранят неисправности вашего устройства в сервисе или с выездом на дом!
http://fastpillsformen.com/# buy Viagra over the counter
http://maxpillsformen.com/# Buy Tadalafil 10mg
https://fastpillseasy.com/# how to get ed meds online
buy ed meds online [url=https://fastpillseasy.com/#]FastPillsEasy[/url] buy ed meds
where to buy erectile dysfunction pills: FastPillsEasy – edmeds
Cialis without a doctor prescription: buy cialis online – Generic Cialis without a doctor prescription
http://fastpillseasy.com/# best online ed pills
http://fastpillsformen.com/# over the counter sildenafil
https://maxpillsformen.com/# Cheap Cialis
cheapest cialis [url=http://maxpillsformen.com/#]MaxPillsForMen[/url] buy cialis pill
best price for viagra 100mg: buy viagra online – viagra without prescription
Buy Tadalafil 10mg [url=https://maxpillsformen.com/#]Generic Cialis without a doctor prescription[/url] Cheap Cialis
sildenafil 50 mg price: FastPillsForMen – sildenafil over the counter
https://maxpillsformen.com/# Buy Tadalafil 5mg
https://fastpillseasy.com/# online prescription for ed
buy cialis pill: MaxPillsForMen.com – buy cialis pill
edmeds: cheap cialis – cheap ed
http://maxpillsformen.com/# cialis for sale
http://maxpillsformen.com/# Cialis without a doctor prescription
best ed meds online [url=http://fastpillseasy.com/#]buy ed pills[/url] best ed meds online
Generic Cialis price [url=https://maxpillsformen.com/#]MaxPillsForMen.com[/url] Buy Tadalafil 10mg
Viagra online price: FastPillsForMen – sildenafil 50 mg price
best online ed treatment: fast pills easy – order ed pills online
http://fastpillsformen.com/# Viagra tablet online
http://maxpillsformen.com/# п»їcialis generic
Generic Cialis price: Generic Cialis without a doctor prescription – Generic Cialis price
Buy Tadalafil 20mg [url=https://maxpillsformen.com/#]buy cialis online[/url] Tadalafil Tablet
Предлагаем услуги профессиональных инженеров офицальной мастерской.
Еслли вы искали срочный ремонт ноутбуков asus, можете посмотреть на сайте: ремонт ноутбуков asus
Наши мастера оперативно устранят неисправности вашего устройства в сервисе или с выездом на дом!
http://maxpillsformen.com/# Generic Cialis price
http://fastpillsformen.com/# order viagra
https://fastpillsformen.com/# Cheap generic Viagra
Buy Tadalafil 10mg [url=http://maxpillsformen.com/#]Max Pills For Men[/url] Tadalafil Tablet
buy ed pills online: cheap cialis – ed online prescription
Предлагаем услуги профессиональных инженеров офицальной мастерской.
Еслли вы искали ремонт ноутбуков asus цены, можете посмотреть на сайте: ремонт ноутбуков asus в москве
Наши мастера оперативно устранят неисправности вашего устройства в сервисе или с выездом на дом!
affordable ed medication: cheap cialis – buy erectile dysfunction medication
http://fastpillsformen.com/# Sildenafil 100mg price
https://maxpillsformen.com/# п»їcialis generic
best price for viagra 100mg [url=https://fastpillsformen.com/#]Viagra tablet online[/url] Cheapest Sildenafil online
Buy Tadalafil 20mg: Max Pills For Men – Generic Tadalafil 20mg price
Tadalafil price [url=http://maxpillsformen.com/#]buy cialis online[/url] buy cialis pill
https://fastpillsformen.com/# Cheap Sildenafil 100mg
https://fastpillsformen.com/# buy viagra here
ed rx online: FastPillsEasy – where can i get ed pills
order ed meds online: cheap cialis – cost of ed meds
Sildenafil Citrate Tablets 100mg: generic sildenafil – viagra canada
cialis for sale [url=https://maxpillsformen.com/#]MaxPillsForMen.com[/url] Buy Tadalafil 10mg
http://fastpillseasy.com/# cheap ed medicine
https://fastpillseasy.com/# pills for erectile dysfunction online
viagra without prescription [url=http://fastpillsformen.com/#]buy viagra online[/url] Viagra online price
online erectile dysfunction pills: cheap cialis – best ed meds online
Viagra online price: cheap viagra – Order Viagra 50 mg online
https://fastpillsformen.com/# buy Viagra online
http://maxpillsformen.com/# Cialis over the counter
http://fastpillsformen.com/# Viagra without a doctor prescription Canada
Buy Tadalafil 5mg: buy cialis online – Buy Cialis online
cialis for sale [url=http://maxpillsformen.com/#]buy cialis online[/url] Buy Tadalafil 10mg
online ed meds [url=https://fastpillseasy.com/#]cheap cialis[/url] online prescription for ed
Viagra tablet online: buy viagra online – Generic Viagra online
https://fastpillsformen.com/# Viagra generic over the counter
http://fastpillseasy.com/# buy ed pills online
Cialis without a doctor prescription: Generic Cialis without a doctor prescription – Cheap Cialis
http://maxpillsformen.com/# Generic Cialis price
Viagra online price [url=http://fastpillsformen.com/#]FastPillsForMen[/url] Generic Viagra for sale
Buy Tadalafil 20mg: Max Pills For Men – Cialis without a doctor prescription
https://fastpillseasy.com/# п»їed pills online
https://maxpillsformen.com/# Generic Cialis without a doctor prescription
Generic Viagra for sale [url=http://fastpillsformen.com/#]FastPillsForMen[/url] Sildenafil Citrate Tablets 100mg
http://fastpillsformen.com/# Cheapest Sildenafil online
Viagra without a doctor prescription Canada: cheap viagra – sildenafil 50 mg price
http://maxpillsformen.com/# Generic Cialis price
https://fastpillseasy.com/# online erectile dysfunction pills
sildenafil 50 mg price: FastPillsForMen – Buy Viagra online cheap
ed pills cheap [url=http://fastpillseasy.com/#]fast pills easy[/url] where to get ed pills
Viagra online price: cheap viagra – sildenafil over the counter
Generic Tadalafil 20mg price [url=https://maxpillsformen.com/#]Generic Cialis without a doctor prescription[/url] cheapest cialis
https://maxpillsformen.com/# Cialis 20mg price
https://fastpillsformen.com/# buy Viagra online
https://maxpillsformen.com/# Buy Cialis online
ed pills cheap: fast pills easy – order ed meds online
ed med online: generic ed meds online – low cost ed pills
http://maxpillsformen.com/# Generic Cialis without a doctor prescription
sildenafil 50 mg price [url=https://fastpillsformen.com/#]FastPillsForMen[/url] Order Viagra 50 mg online
https://fastpillsformen.com/# Cheap generic Viagra
how to get ed meds online: fast pills easy – cheapest erectile dysfunction pills
buy erectile dysfunction pills [url=https://fastpillseasy.com/#]fast pills easy[/url] erectile dysfunction online
low cost ed meds online: fast pills easy – ed medication online
http://maxpillsformen.com/# buy cialis pill
http://fastpillsformen.com/# Viagra tablet online
http://fastpillseasy.com/# low cost ed meds
Cialis 20mg price in USA: Max Pills For Men – Buy Tadalafil 20mg
http://maxpillsformen.com/# Cialis over the counter
sildenafil over the counter: buy viagra online – buy Viagra over the counter
http://maxpillsformen.com/# Generic Cialis price
http://fastpillsformen.com/# order viagra
where can i buy erectile dysfunction pills [url=https://fastpillseasy.com/#]cheap cialis[/url] ed prescriptions online
Предлагаем услуги профессиональных инженеров офицальной мастерской.
Еслли вы искали ремонт ноутбуков acer рядом, можете посмотреть на сайте: ремонт ноутбуков acer рядом
Наши мастера оперативно устранят неисправности вашего устройства в сервисе или с выездом на дом!
https://fastpillsformen.com/# Cheapest Sildenafil online
Предлагаем услуги профессиональных инженеров офицальной мастерской.
Еслли вы искали срочный ремонт macbook pro m3, можете посмотреть на сайте: ремонт macbook pro m3 в москве
Наши мастера оперативно устранят неисправности вашего устройства в сервисе или с выездом на дом!
Cialis without a doctor prescription: MaxPillsForMen.com – Tadalafil price
Предлагаем услуги профессиональных инженеров офицальной мастерской.
Еслли вы искали ремонт ноутбуков hp, можете посмотреть на сайте: ремонт ноутбуков hp рядом
Наши мастера оперативно устранят неисправности вашего устройства в сервисе или с выездом на дом!
Предлагаем услуги профессиональных инженеров офицальной мастерской.
Еслли вы искали срочный ремонт macbook pro 16, можете посмотреть на сайте: ремонт macbook pro 16 адреса
Наши мастера оперативно устранят неисправности вашего устройства в сервисе или с выездом на дом!
Предлагаем услуги профессиональных инженеров офицальной мастерской.
Еслли вы искали ремонт ноутбуков acer, можете посмотреть на сайте: ремонт ноутбуков acer адреса
Наши мастера оперативно устранят неисправности вашего устройства в сервисе или с выездом на дом!
buy Viagra online: cheap viagra – over the counter sildenafil
https://fastpillseasy.com/# cheap ed pills online
Предлагаем услуги профессиональных инженеров офицальной мастерской.
Еслли вы искали ремонт macbook pro m3, можете посмотреть на сайте: ремонт macbook pro m3 рядом
Наши мастера оперативно устранят неисправности вашего устройства в сервисе или с выездом на дом!
sildenafil online [url=http://fastpillsformen.com/#]cheap viagra[/url] cheap viagra
best price for viagra 100mg [url=http://fastpillsformen.com/#]Fast Pills For Men[/url] best price for viagra 100mg
http://maxpillsformen.com/# Cheap Cialis
Generic Cialis without a doctor prescription: Cialis over the counter – cialis for sale
Предлагаем услуги профессиональных инженеров офицальной мастерской.
Еслли вы искали ремонт ноутбуков hp в москве, можете посмотреть на сайте: ремонт ноутбуков hp сервис
Наши мастера оперативно устранят неисправности вашего устройства в сервисе или с выездом на дом!
Предлагаем услуги профессиональных инженеров офицальной мастерской.
Еслли вы искали ремонт macbook pro 16, можете посмотреть на сайте: срочный ремонт macbook pro 16
Наши мастера оперативно устранят неисправности вашего устройства в сервисе или с выездом на дом!
http://fastpillsformen.com/# Viagra Tablet price
how to get ed pills: cheap cialis – what is the cheapest ed medication
Buy generic 100mg Viagra online [url=http://fastpillsformen.com/#]cheap viagra[/url] Cheapest Sildenafil online
Предлагаем услуги профессиональных инженеров офицальной мастерской.
Еслли вы искали ремонт кофемашин spidem, можете посмотреть на сайте: ремонт кофемашин spidem
Наши мастера оперативно устранят неисправности вашего устройства в сервисе или с выездом на дом!
Viagra generic over the counter: FastPillsForMen – Viagra online price
Cialis without a doctor prescription [url=http://maxpillsformen.com/#]Buy Cialis online[/url] Tadalafil Tablet
generic sildenafil: FastPillsForMen – Cheap generic Viagra online
http://fastpillsformen.com/# Cheap generic Viagra online
Предлагаем услуги профессиональных инженеров офицальной мастерской.
Еслли вы искали ремонт кофемашин spidem рядом, можете посмотреть на сайте: ремонт кофемашин spidem в москве
Наши мастера оперативно устранят неисправности вашего устройства в сервисе или с выездом на дом!
https://fastpillseasy.com/# best ed meds online
where to get ed pills: erection pills online – get ed prescription online
Viagra online price [url=https://fastpillsformen.com/#]buy viagra online[/url] Order Viagra 50 mg online
online ed pills [url=http://fastpillseasy.com/#]FastPillsEasy[/url] ed medicines
Предлагаем услуги профессиональных инженеров офицальной мастерской.
Еслли вы искали ремонт кофемашин neff цены, можете посмотреть на сайте: ремонт кофемашин neff
Наши мастера оперативно устранят неисправности вашего устройства в сервисе или с выездом на дом!
how to get ed meds online: fast pills easy – online ed medication
http://fastpillseasy.com/# erectile dysfunction medicine online
Предлагаем услуги профессиональных инженеров офицальной мастерской.
Еслли вы искали ремонт кофемашин melitta сервис, можете посмотреть на сайте: ремонт кофемашин melitta сервис
Наши мастера оперативно устранят неисправности вашего устройства в сервисе или с выездом на дом!
Предлагаем услуги профессиональных инженеров офицальной мастерской.
Еслли вы искали ремонт кофемашин philips адреса, можете посмотреть на сайте: ремонт кофемашин philips рядом
Наши мастера оперативно устранят неисправности вашего устройства в сервисе или с выездом на дом!
Предлагаем услуги профессиональных инженеров офицальной мастерской.
Еслли вы искали ремонт macbook air m1 рядом, можете посмотреть на сайте: срочный ремонт macbook air m1
Наши мастера оперативно устранят неисправности вашего устройства в сервисе или с выездом на дом!
Предлагаем услуги профессиональных инженеров офицальной мастерской.
Еслли вы искали срочный ремонт кофемашин neff, можете посмотреть на сайте: ремонт кофемашин neff
Наши мастера оперативно устранят неисправности вашего устройства в сервисе или с выездом на дом!
http://fastpillseasy.com/# affordable ed medication
Предлагаем услуги профессиональных инженеров офицальной мастерской.
Еслли вы искали ремонт кофемашин melitta цены, можете посмотреть на сайте: ремонт кофемашин melitta рядом
Наши мастера оперативно устранят неисправности вашего устройства в сервисе или с выездом на дом!
Viagra tablet online [url=https://fastpillsformen.com/#]FastPillsForMen[/url] over the counter sildenafil
ed meds by mail: cheap cialis – top rated ed pills
Предлагаем услуги профессиональных инженеров офицальной мастерской.
Еслли вы искали ремонт кофемашин philips в москве, можете посмотреть на сайте: ремонт кофемашин philips цены
Наши мастера оперативно устранят неисправности вашего устройства в сервисе или с выездом на дом!
Предлагаем услуги профессиональных инженеров офицальной мастерской.
Еслли вы искали ремонт macbook air m1 сервис, можете посмотреть на сайте: ремонт macbook air m1 рядом
Наши мастера оперативно устранят неисправности вашего устройства в сервисе или с выездом на дом!
Предлагаем услуги профессиональных инженеров офицальной мастерской.
Еслли вы искали ремонт кофемашин miele цены, можете посмотреть на сайте: ремонт кофемашин miele рядом
Наши мастера оперативно устранят неисправности вашего устройства в сервисе или с выездом на дом!
https://slotsiteleri25.com/# slot siteleri
https://casinositeleri25.com/# casino bahis siteleri
Предлагаем услуги профессиональных инженеров офицальной мастерской.
Еслли вы искали ремонт кофемашин delonghi рядом, можете посмотреть на сайте: ремонт кофемашин delonghi
Наши мастера оперативно устранят неисправности вашего устройства в сервисе или с выездом на дом!
sweet bonanza yorumlar: sweet bonanza oyna – sweet bonanza guncel
yat?r?ms?z deneme bonusu veren siteler [url=https://denemebonusuverensiteler25.com/#]yat?r?ms?z deneme bonusu veren siteler[/url] denemebonusuverensiteler25
https://slotsiteleri25.com/# en kazancl? slot oyunlar?
https://slotsiteleri25.com/# guvenilir slot siteleri
https://denemebonusuverensiteler25.com/# deneme bonusu veren siteler
Предлагаем услуги профессиональных инженеров офицальной мастерской.
Еслли вы искали ремонт кофемашин miele в москве, можете посмотреть на сайте: ремонт кофемашин miele рядом
Наши мастера оперативно устранят неисправности вашего устройства в сервисе или с выездом на дом!
Предлагаем услуги профессиональных инженеров офицальной мастерской.
Еслли вы искали ремонт кофемашин delonghi, можете посмотреть на сайте: ремонт кофемашин delonghi рядом
Наши мастера оперативно устранят неисправности вашего устройства в сервисе или с выездом на дом!
Предлагаем услуги профессиональных инженеров офицальной мастерской.
Еслли вы искали ремонт iphone xs сервис, можете посмотреть на сайте: ремонт iphone xs в москве
Наши мастера оперативно устранят неисправности вашего устройства в сервисе или с выездом на дом!
sweet bonanza yorumlar: sweet bonanza guncel – sweet bonanza oyna
sweet bonanza kazanma saatleri [url=https://sweetbonanza25.com/#]sweet bonanza giris[/url] sweet bonanza slot
guvenilir casino siteleri: canl? casino siteleri – Canl? Casino Siteleri
https://slotsiteleri25.com/# az parayla cok kazandiran slot oyunlar?
https://casinositeleri25.com/# Casino Siteleri
http://sweetbonanza25.com/# sweet bonanza slot
slot siteleri [url=http://slotsiteleri25.com/#]slot siteleri[/url] en kazancl? slot oyunlar?
Предлагаем услуги профессиональных инженеров офицальной мастерской.
Еслли вы искали ремонт iphone xs цены, можете посмотреть на сайте: ремонт iphone xs адреса
Наши мастера оперативно устранят неисправности вашего устройства в сервисе или с выездом на дом!
deneme bonusu veren siteler: yeni deneme bonusu veren siteler – yeni deneme bonusu veren siteler
https://denemebonusuverensiteler25.com/# yat?r?ms?z deneme bonusu veren siteler
https://denemebonusuverensiteler25.com/# deneme bonusu veren siteler
slot oyunlar?: slot oyunlar? – guvenilir slot siteleri
http://casinositeleri25.com/# Casino Siteleri
http://slotsiteleri25.com/# slot oyunlar?
http://slotsiteleri25.com/# en cok kazand?ran slot oyunlar?
guvenilir casino siteleri: deneme bonusu veren bГјtГјn siteler – Canl? Casino Siteleri
https://slotsiteleri25.com/# slot oyunlar? puf noktalar?
Deneme Bonusu Veren Siteler [url=http://casinositeleri25.com/#]Canl? Casino Siteleri[/url] Deneme Bonusu Veren Siteler
sweet bonanza oyna: sweet bonanza – sweet bonanza slot
Deneme Bonusu Veren Siteler: bahis siyeleri – gГјvenilir canlД± bahis casino siteleri
https://slotsiteleri25.com/# guvenilir slot siteleri
deneme bonusu veren siteler [url=https://denemebonusuverensiteler25.com/#]yeni deneme bonusu veren siteler[/url] deneme bonusu veren siteler
https://slotsiteleri25.com/# en cok kazand?ran slot oyunlar?
curacao lisans siteleri: Deneme Bonusu Veren Siteler – canl? casino siteleri
deneme bonusu veren siteler: deneme bonusu veren yeni siteler – deneme bonusu veren siteler
guvenilir slot siteleri [url=https://slotsiteleri25.com/#]slot oyunlar? puf noktalar?[/url] guvenilir slot siteleri
https://denemebonusuverensiteler25.com/# yeni deneme bonusu veren siteler
sweet bonanza kazanma saatleri: sweet bonanza slot – sweet bonanza slot
http://casinositeleri25.com/# Casino Siteleri
en guvenilir casino siteleri: casino bahis siteleri – Casino Siteleri
slot siteleri [url=https://slotsiteleri25.com/#]az parayla cok kazandiran slot oyunlar?[/url] slot oyunlar?
sweet bonanza demo oyna: sweet bonanza – sweet bonanza oyna
deneme bonusu veren siteler: yeni deneme bonusu veren siteler – denemebonusuverensiteler25
https://slotsiteleri25.com/# guvenilir slot siteleri
guvenilir slot siteleri [url=http://slotsiteleri25.com/#]slot siteleri[/url] en cok kazand?ran slot oyunlar?
https://denemebonusuverensiteler25.com/# deneme bonusu veren yeni siteler
Houston Lasik and Eye gave me the best experience ever how can i get clomid In two large studies using letrozole conducted by the Reproductive Medicine Network, the anomaly rates were comparable between clomiphene and letrozole
slot casino siteleri [url=https://slotsiteleri25.com/#]guvenilir slot siteleri[/url] slot oyunlar? puf noktalar?
deneme bonusu veren yeni siteler: yat?r?ms?z deneme bonusu veren siteler – denemebonusuverensiteler25
http://casinositeleri25.com/# canl? casino siteleri
sweet bonanza guncel: sweet bonanza demo oyna – sweet bonanza guncel
slot oyunlar? puf noktalar?: guvenilir slot siteleri – en cok kazand?ran slot oyunlar?
Canl? Casino Siteleri [url=https://casinositeleri25.com/#]deneme bonusu veren casino siteleri[/url] deneme bonusu veren casino siteleri
Casino Siteleri: Casino Siteleri – deneme bonusu veren casino siteleri
Предлагаем услуги профессиональных инженеров офицальной мастерской.
Еслли вы искали ремонт iphone 14 адреса, можете посмотреть на сайте: ремонт iphone 14 цены
Наши мастера оперативно устранят неисправности вашего устройства в сервисе или с выездом на дом!
https://casinositeleri25.com/# Casino Siteleri
en kazancl? slot oyunlar?: slot siteleri – guvenilir slot siteleri
gore siteler
guvenilir slot siteleri: en cok kazand?ran slot oyunlar? – az parayla cok kazandiran slot oyunlar?
Предлагаем услуги профессиональных инженеров офицальной мастерской.
Еслли вы искали срочный ремонт iphone 14, можете посмотреть на сайте: срочный ремонт iphone 14
Наши мастера оперативно устранят неисправности вашего устройства в сервисе или с выездом на дом!
sweet bonanza yorumlar [url=http://sweetbonanza25.com/#]sweet bonanza slot[/url] sweet bonanza
Предлагаем услуги профессиональных инженеров офицальной мастерской.
Еслли вы искали ремонт iphone 15 pro max, можете посмотреть на сайте: ремонт iphone 15 pro max сервис
Наши мастера оперативно устранят неисправности вашего устройства в сервисе или с выездом на дом!
https://denemebonusuverensiteler25.com/# deneme bonusu veren siteler
sweet bonanza yorumlar [url=https://sweetbonanza25.com/#]sweet bonanza giris[/url] sweet bonanza slot
sweet bonanza slot: sweet bonanza demo oyna – sweet bonanza giris
Casino Siteleri: Casino Siteleri – deneme bonusu veren casino siteleri
https://sweetbonanza25.com/# sweet bonanza oyna
sweet bonanza giris: sweet bonanza yorumlar – sweet bonanza guncel
18siteler [url=https://casinositeleri25.com/#]deneme bonusu veren bГјtГјn siteler[/url] Casino Siteleri
Предлагаем услуги профессиональных инженеров офицальной мастерской.
Еслли вы искали ремонт iphone 15 pro max в москве, можете посмотреть на сайте: ремонт iphone 15 pro max
Наши мастера оперативно устранят неисправности вашего устройства в сервисе или с выездом на дом!
sweet bonanza: sweet bonanza oyna – sweet bonanza yorumlar
sweet bonanza kazanma saatleri [url=https://sweetbonanza25.com/#]sweet bonanza kazanma saatleri[/url] sweet bonanza demo oyna
sweet bonanza demo oyna: sweet bonanza slot – sweet bonanza demo oyna
Предлагаем услуги профессиональных инженеров офицальной мастерской.
Еслли вы искали ремонт iphone 15 цены, можете посмотреть на сайте: ремонт iphone 15
Наши мастера оперативно устранят неисправности вашего устройства в сервисе или с выездом на дом!
Casino Siteleri: Canl? Casino Siteleri – Deneme Bonusu Veren Siteler
deneme bonusu veren siteler yeni [url=https://denemebonusuverensiteler25.com/#]deneme bonusu veren siteler yeni[/url] deneme bonusu veren siteler yeni
http://casinositeleri25.com/# Canl? Casino Siteleri
yeni deneme bonusu veren siteler [url=http://denemebonusuverensiteler25.com/#]denemebonusuverensiteler25[/url] yat?r?ms?z deneme bonusu veren siteler
Предлагаем услуги профессиональных инженеров офицальной мастерской.
Еслли вы искали ремонт iphone 15 адреса, можете посмотреть на сайте: ремонт iphone 15 адреса
Наши мастера оперативно устранят неисправности вашего устройства в сервисе или с выездом на дом!
slot siteleri: guvenilir slot siteleri – slot oyunlar? puf noktalar?
denemebonusuverensiteler25: denemebonusuverensiteler25 – deneme bonusu veren siteler yeni
deneme bonusu veren yeni siteler: yat?r?ms?z deneme bonusu veren siteler – deneme bonusu veren siteler yeni
sweet bonanza giris [url=http://sweetbonanza25.com/#]sweet bonanza[/url] sweet bonanza oyna
http://slotsiteleri25.com/# slot oyunlar?
guvenilir slot siteleri [url=http://slotsiteleri25.com/#]slot siteleri[/url] guvenilir slot siteleri
yeni deneme bonusu veren siteler: yeni deneme bonusu veren siteler – deneme bonusu veren siteler yeni
deneme bonusu veren siteler: deneme bonusu veren yeni siteler – yeni deneme bonusu veren siteler
https://slotsiteleri25.com/# en cok kazand?ran slot oyunlar?
sweet bonanza [url=https://sweetbonanza25.com/#]sweet bonanza demo oyna[/url] sweet bonanza giris
guvenilir slot siteleri: guvenilir slot siteleri – slot casino siteleri
yeni deneme bonusu veren siteler [url=https://denemebonusuverensiteler25.com/#]deneme bonusu veren siteler[/url] denemebonusuverensiteler25
Предлагаем услуги профессиональных инженеров офицальной мастерской.
Еслли вы искали ремонт iphone 14 pro max, можете посмотреть на сайте: срочный ремонт iphone 14 pro max
Наши мастера оперативно устранят неисправности вашего устройства в сервисе или с выездом на дом!
Предлагаем услуги профессиональных инженеров офицальной мастерской.
Еслли вы искали ремонт iphone 14 pro в москве, можете посмотреть на сайте: ремонт iphone 14 pro
Наши мастера оперативно устранят неисправности вашего устройства в сервисе или с выездом на дом!
https://denemebonusuverensiteler25.com/# denemebonusuverensiteler25
sweet bonanza demo oyna: sweet bonanza demo oyna – sweet bonanza slot
cazinomaxi: Casino Siteleri – tГјrkiye casino siteleri
denemebonusuverensiteler25: yeni deneme bonusu veren siteler – deneme bonusu veren siteler
https://slotsiteleri25.com/# en cok kazand?ran slot oyunlar?
sweet bonanza guncel [url=https://sweetbonanza25.com/#]sweet bonanza kazanma saatleri[/url] sweet bonanza kazanma saatleri
Предлагаем услуги профессиональных инженеров офицальной мастерской.
Еслли вы искали ремонт iphone 14 pro max в москве, можете посмотреть на сайте: ремонт iphone 14 pro max адреса
Наши мастера оперативно устранят неисправности вашего устройства в сервисе или с выездом на дом!
Предлагаем услуги профессиональных инженеров офицальной мастерской.
Еслли вы искали ремонт iphone 14 pro сервис, можете посмотреть на сайте: срочный ремонт iphone 14 pro
Наши мастера оперативно устранят неисправности вашего устройства в сервисе или с выездом на дом!
yat?r?ms?z deneme bonusu veren siteler: yeni deneme bonusu veren siteler – deneme bonusu veren yeni siteler
en cok kazand?ran slot oyunlar?: slot oyunlar? puf noktalar? – guvenilir slot siteleri
https://mexicaneasypharm.shop/# medicine in mexico pharmacies
pharmacy wholesalers canada
canadian world pharmacy [url=https://canadianmdpharm.com/#]Canadian Md Pharm[/url] ed meds online canada
canadian pharmacy sarasota: canadian discount pharmacy – canadian pharmacies online
canadian pharmacy in canada https://mexicaneasypharm.shop/# Mexican Easy Pharm
top online pharmacy india
Mexican Easy Pharm: Mexican Easy Pharm – Mexican Easy Pharm
https://indiancertpharm.com/# Indian Cert Pharm
reliable canadian online pharmacy
canadianpharmacymeds com https://indiancertpharm.shop/# reputable indian pharmacies
world pharmacy india
pharmacies in mexico that ship to usa: buying prescription drugs in mexico – Mexican Easy Pharm
canada drugs online: Canadian Md Pharm – precription drugs from canada
Предлагаем услуги профессиональных инженеров офицальной мастерской.
Еслли вы искали ремонт iphone xs max, можете посмотреть на сайте: ремонт iphone xs max сервис
Наши мастера оперативно устранят неисправности вашего устройства в сервисе или с выездом на дом!
reliable canadian pharmacy https://mexicaneasypharm.com/# Mexican Easy Pharm
india online pharmacy
canadianpharmacymeds com: CanadianMdPharm – best canadian online pharmacy
Предлагаем услуги профессиональных инженеров офицальной мастерской.
Еслли вы искали ремонт iphone se 2020 в москве, можете посмотреть на сайте: срочный ремонт iphone se 2020
Наши мастера оперативно устранят неисправности вашего устройства в сервисе или с выездом на дом!
Online pharmacy [url=https://indiancertpharm.com/#]Indian Cert Pharm[/url] Indian pharmacy international shipping
reliable canadian pharmacy https://mexicaneasypharm.com/# medication from mexico pharmacy
india online pharmacy
https://canadianmdpharm.shop/# recommended canadian pharmacies
safe canadian pharmacy
medication from mexico pharmacy: Mexican Easy Pharm – purple pharmacy mexico price list
canadianpharmacyworld: canadian discount pharmacy – canadian pharmacy world
Предлагаем услуги профессиональных инженеров офицальной мастерской.
Еслли вы искали ремонт iphone 13 pro в москве, можете посмотреть на сайте: ремонт iphone 13 pro адреса
Наши мастера оперативно устранят неисправности вашего устройства в сервисе или с выездом на дом!
Предлагаем услуги профессиональных инженеров офицальной мастерской.
Еслли вы искали ремонт iphone 13 адреса, можете посмотреть на сайте: ремонт iphone 13 цены
Наши мастера оперативно устранят неисправности вашего устройства в сервисе или с выездом на дом!
buying prescription drugs in mexico online [url=https://mexicaneasypharm.shop/#]Mexican Easy Pharm[/url] п»їbest mexican online pharmacies
https://canadianmdpharm.online/# best canadian pharmacy
maple leaf pharmacy in canada
п»їbest mexican online pharmacies: mexican border pharmacies shipping to usa – buying prescription drugs in mexico
Предлагаем услуги профессиональных инженеров офицальной мастерской.
Еслли вы искали срочный ремонт iphone xs max, можете посмотреть на сайте: срочный ремонт iphone xs max
Наши мастера оперативно устранят неисправности вашего устройства в сервисе или с выездом на дом!
reliable canadian pharmacy reviews https://indiancertpharm.com/# Indian Cert Pharm
world pharmacy india
Mexican Easy Pharm: Mexican Easy Pharm – mexico drug stores pharmacies
Предлагаем услуги профессиональных инженеров офицальной мастерской.
Еслли вы искали ремонт iphone se 2020 цены, можете посмотреть на сайте: срочный ремонт iphone se 2020
Наши мастера оперативно устранят неисправности вашего устройства в сервисе или с выездом на дом!
mexican drugstore online: mexican pharmaceuticals online – Mexican Easy Pharm
Best online Indian pharmacy: Indian pharmacy that ships to usa – Online medicine
medication canadian pharmacy https://canadianmdpharm.com/# pharmacy rx world canada
india pharmacy
Mexican Easy Pharm: Mexican Easy Pharm – mexican rx online
Online pharmacy [url=https://indiancertpharm.shop/#]reputable indian pharmacies[/url] Indian Cert Pharm
888starz casino live CГґte d’ivoire
Mexican Easy Pharm: mexico drug stores pharmacies – reputable mexican pharmacies online
Indian Cert Pharm [url=https://indiancertpharm.shop/#]Indian pharmacy international shipping[/url] top 10 online pharmacy in india
Mexican Easy Pharm: mexican border pharmacies shipping to usa – Mexican Easy Pharm
canadian drug https://indiancertpharm.shop/# indian pharmacy paypal
world pharmacy india
Предлагаем услуги профессиональных инженеров офицальной мастерской.
Еслли вы искали ремонт iphone 13 pro адреса, можете посмотреть на сайте: ремонт iphone 13 pro
Наши мастера оперативно устранят неисправности вашего устройства в сервисе или с выездом на дом!
Предлагаем услуги профессиональных инженеров офицальной мастерской.
Еслли вы искали срочный ремонт iphone 13, можете посмотреть на сайте: ремонт iphone 13
Наши мастера оперативно устранят неисправности вашего устройства в сервисе или с выездом на дом!
Mexican Easy Pharm: Mexican Easy Pharm – Mexican Easy Pharm
Indian Cert Pharm: Indian pharmacy that ships to usa – Indian pharmacy that ships to usa
best rated canadian pharmacy https://mexicaneasypharm.shop/# Mexican Easy Pharm
india online pharmacy
is canadian pharmacy legit https://mexicaneasypharm.com/# Mexican Easy Pharm
indian pharmacy paypal
pet meds without vet prescription canada: Canadian Md Pharm – best canadian pharmacy
global pharmacy canada [url=https://canadianmdpharm.com/#]Canadian Md Pharm[/url] canadian pharmacy meds
canada drug pharmacy: Canadian Md Pharm – pharmacy canadian superstore
mexican drugstore online: Mexican Easy Pharm – purple pharmacy mexico price list
Mexican Easy Pharm: Mexican Easy Pharm – Mexican Easy Pharm
https://canadianmdpharm.online/# medication canadian pharmacy
reliable canadian pharmacy
Best online Indian pharmacy: Indian Cert Pharm – Online pharmacy
cheap canadian pharmacy https://indiancertpharm.com/# Indian Cert Pharm
best india pharmacy
legit canadian pharmacy: canadian drug – best canadian pharmacy
adderall canadian pharmacy https://canadianmdpharm.com/# canadian pharmacy online ship to usa
top online pharmacy india
Fairspin
best india pharmacy: Online pharmacy – IndianCertPharm
reputable canadian online pharmacy: Canadian Md Pharm – canada online pharmacy
Indian Cert Pharm: Indian pharmacy international shipping – indian pharmacy
canadian pharmacy service [url=https://canadianmdpharm.shop/#]canadian pharmacy 24 com[/url] vipps canadian pharmacy
onlinepharmaciescanada com: CanadianMdPharm – safe canadian pharmacies
medicine in mexico pharmacies: mexican mail order pharmacies – Mexican Easy Pharm
Mexican Easy Pharm: reputable mexican pharmacies online – buying from online mexican pharmacy
canada drugstore pharmacy rx https://canadianmdpharm.com/# canadian pharmacy victoza
Online medicine order
https://indiancertpharm.shop/# Indian Cert Pharm
best canadian online pharmacy
canadian discount pharmacy https://mexicaneasypharm.com/# Mexican Easy Pharm
buy medicines online in india
Mexican Easy Pharm: Mexican Easy Pharm – medication from mexico pharmacy
safe canadian pharmacy: Canadian Md Pharm – canadian pharmacy india
pharmacy wholesalers canada: CanadianMdPharm – pet meds without vet prescription canada
Mexican Easy Pharm [url=https://mexicaneasypharm.shop/#]Mexican Easy Pharm[/url] mexican online pharmacies prescription drugs
Indian Cert Pharm: Indian Cert Pharm – Indian pharmacy international shipping
Best Indian pharmacy: Best Indian pharmacy – Indian Cert Pharm
Mexican Easy Pharm [url=https://mexicaneasypharm.com/#]mexican drugstore online[/url] Mexican Easy Pharm
IndianCertPharm: Online medicine – Indian Cert Pharm
canada rx pharmacy https://canadianmdpharm.shop/# canada cloud pharmacy
top online pharmacy india
buying from online mexican pharmacy: mexican border pharmacies shipping to usa – mexico drug stores pharmacies
reputable mexican pharmacies online: mexico drug stores pharmacies – buying from online mexican pharmacy
legal to buy prescription drugs from canada: Canadian Md Pharm – canada drug pharmacy
buying prescription drugs in mexico: reputable mexican pharmacies online – Mexican Easy Pharm
Mexican Easy Pharm: best online pharmacies in mexico – mexico drug stores pharmacies
Mexican Easy Pharm: mexican pharmaceuticals online – mexico drug stores pharmacies
Предлагаем услуги профессиональных инженеров офицальной мастерской.
Еслли вы искали ремонт iphone 11 в москве, можете посмотреть на сайте: срочный ремонт iphone 11
Наши мастера оперативно устранят неисправности вашего устройства в сервисе или с выездом на дом!
Предлагаем услуги профессиональных инженеров офицальной мастерской.
Еслли вы искали ремонт iphone 12 pro max в москве, можете посмотреть на сайте: ремонт iphone 12 pro max рядом
Наши мастера оперативно устранят неисправности вашего устройства в сервисе или с выездом на дом!
canadian pharmacy antibiotics: best canadian pharmacy to order from – canadian pharmacy no scripts
Mexican Easy Pharm: mexican online pharmacies prescription drugs – Mexican Easy Pharm
indian pharmacy: Indian Cert Pharm – Indian Cert Pharm
indian pharmacy: indian pharmacy – IndianCertPharm
Indian pharmacy international shipping: Indian Cert Pharm – indian pharmacy
https://indiancertpharm.shop/# IndianCertPharm
my canadian pharmacy review
mexican drugstore online: medication from mexico pharmacy – mexico pharmacies prescription drugs
Предлагаем услуги профессиональных инженеров офицальной мастерской.
Еслли вы искали ремонт iphone se 2020 рядом, можете посмотреть на сайте: ремонт iphone se 2020
Наши мастера оперативно устранят неисправности вашего устройства в сервисе или с выездом на дом!
Best online Indian pharmacy: indian pharmacy – Indian pharmacy that ships to usa
Online medicine: Indian Cert Pharm – Indian Cert Pharm
mexican online pharmacies prescription drugs: mexico pharmacies prescription drugs – п»їbest mexican online pharmacies
canadian pharmacies that deliver to the us: CanadianMdPharm – pet meds without vet prescription canada
top 10 online pharmacy in india: Online medicine – IndianCertPharm
https://mexicaneasypharm.shop/# buying prescription drugs in mexico online
legitimate canadian pharmacies
Online medicine: Online pharmacy – Indian pharmacy international shipping
mexico drug stores pharmacies: Mexican Easy Pharm – mexican border pharmacies shipping to usa
indian pharmacy: Indian Cert Pharm – Best online Indian pharmacy
Предлагаем услуги профессиональных инженеров офицальной мастерской.
Еслли вы искали срочный ремонт iphone 11, можете посмотреть на сайте: ремонт iphone 11 цены
Наши мастера оперативно устранят неисправности вашего устройства в сервисе или с выездом на дом!
Предлагаем услуги профессиональных инженеров офицальной мастерской.
Еслли вы искали ремонт iphone se 2020, можете посмотреть на сайте: ремонт iphone se 2020
Наши мастера оперативно устранят неисправности вашего устройства в сервисе или с выездом на дом!
Предлагаем услуги профессиональных инженеров офицальной мастерской.
Еслли вы искали ремонт iphone 12 pro max, можете посмотреть на сайте: срочный ремонт iphone 12 pro max
Наши мастера оперативно устранят неисправности вашего устройства в сервисе или с выездом на дом!
legit canadian pharmacy online: CanadianMdPharm – canadian pharmacy com
Online pharmacy: Indian Cert Pharm – Best online Indian pharmacy
pharmacy canadian: Canadian Md Pharm – canadianpharmacyworld
best rated canadian pharmacy https://indiancertpharm.com/# Best Indian pharmacy
pharmacy website india
Online pharmacy: п»їlegitimate online pharmacies india – indian pharmacy
maple leaf pharmacy in canada https://canadianmdpharm.com/# canada rx pharmacy world
best india pharmacy
canadian pharmacy 24 com: Canadian Md Pharm – canadian pharmacy 24 com
indian pharmacy: IndianCertPharm – Indian Cert Pharm
reputable mexican pharmacies online: Mexican Easy Pharm – Mexican Easy Pharm
mexican pharmaceuticals online: Mexican Easy Pharm – Mexican Easy Pharm
Online medicine: indian pharmacy – Indian Cert Pharm
Mexican Easy Pharm: п»їbest mexican online pharmacies – Mexican Easy Pharm
https://indiancertpharm.shop/# Indian Cert Pharm
canadian pharmacy 365
Mexican Easy Pharm: Mexican Easy Pharm – Mexican Easy Pharm
buy canadian drugs: Canadian Md Pharm – canadian pharmacy service
buying from canadian pharmacies: CanadianMdPharm – canadian 24 hour pharmacy
onlinecanadianpharmacy 24: legitimate canadian mail order pharmacy – cheapest pharmacy canada
Online medicine: Indian Cert Pharm – Online pharmacy
Indian pharmacy international shipping: Best online Indian pharmacy – Best online Indian pharmacy
https://mexicaneasypharm.com/# mexican online pharmacies prescription drugs
northwest pharmacy canada
canadian pharmacy tampa: CanadianMdPharm – canada drugs
Mexican Easy Pharm: buying prescription drugs in mexico – Mexican Easy Pharm
Indian Cert Pharm: Indian pharmacy international shipping – Indian pharmacy that ships to usa
Best online Indian pharmacy: IndianCertPharm – mail order pharmacy india
Предлагаем услуги профессиональных инженеров офицальной мастерской.
Еслли вы искали ремонт ipad mini 3 цены, можете посмотреть на сайте: ремонт ipad mini 3 в москве
Наши мастера оперативно устранят неисправности вашего устройства в сервисе или с выездом на дом!
best canadian pharmacy online: Canadian Md Pharm – canadian pharmacy store
canadian pharmacy ed medications: trusted canadian pharmacy – canadian pharmacy cheap
Mexican Easy Pharm: best online pharmacies in mexico – reputable mexican pharmacies online
mexican mail order pharmacies: buying prescription drugs in mexico – п»їbest mexican online pharmacies
best online canadian pharmacy: my canadian pharmacy reviews – canadian pharmacy in canada
Предлагаем услуги профессиональных инженеров офицальной мастерской.
Еслли вы искали ремонт ipad mini 4, можете посмотреть на сайте: ремонт ipad mini 4 в москве
Наши мастера оперативно устранят неисправности вашего устройства в сервисе или с выездом на дом!
Предлагаем услуги профессиональных инженеров офицальной мастерской.
Еслли вы искали ремонт ipad pro 12.9, можете посмотреть на сайте: ремонт ipad pro 12.9 сервис
Наши мастера оперативно устранят неисправности вашего устройства в сервисе или с выездом на дом!
legit canadian online pharmacy [url=https://canadianmdpharm.shop/#]Canadian Md Pharm[/url] canadian pharmacy near me
Online medicine: Online pharmacy – Best Indian pharmacy
Предлагаем услуги профессиональных инженеров офицальной мастерской.
Еслли вы искали срочный ремонт ipad mini 3, можете посмотреть на сайте: ремонт ipad mini 3 цены
Наши мастера оперативно устранят неисправности вашего устройства в сервисе или с выездом на дом!
cross border pharmacy canada: Canadian Md Pharm – safe canadian pharmacies
canadian pharmacy 24 com: Canadian Md Pharm – canadian drug prices
purple pharmacy mexico price list [url=https://mexicaneasypharm.shop/#]Mexican Easy Pharm[/url] mexican pharmaceuticals online
recommended canadian pharmacies: Canadian Md Pharm – canadian pharmacy king reviews
https://indiancertpharm.com/# Indian pharmacy international shipping
canadian pharmacy sarasota
canadian pharmacy meds review: CanadianMdPharm – onlinepharmaciescanada com
Mexican Easy Pharm: Mexican Easy Pharm – medicine in mexico pharmacies
canadian pharmacy king: Canadian Md Pharm – canadian medications
the canadian pharmacy: CanadianMdPharm – reliable canadian pharmacy
top 10 online pharmacy in india [url=https://indiancertpharm.shop/#]Online pharmacy[/url] Indian Cert Pharm
Indian pharmacy international shipping: Indian Cert Pharm – IndianCertPharm
Best Indian pharmacy: Indian Cert Pharm – Best Indian pharmacy
mexico pharmacies prescription drugs: Mexican Easy Pharm – mexico drug stores pharmacies
Online pharmacy [url=https://indiancertpharm.com/#]IndianCertPharm[/url] Best online Indian pharmacy
pharmacies in mexico that ship to usa https://mexicaneasypharm.shop/# Mexican Easy Pharm
mexico drug stores pharmacies
best online pharmacies in mexico https://mexicaneasypharm.com/# Mexican Easy Pharm
mexico drug stores pharmacies
Indian pharmacy that ships to usa: Online medicine – online shopping pharmacy india
canadian online drugs: canadian pharmacies – canadian pharmacy store
https://mexicaneasypharm.com/# mexican mail order pharmacies
canadian drug stores
Предлагаем услуги профессиональных инженеров офицальной мастерской.
Еслли вы искали ремонт ipad mini 4 адреса, можете посмотреть на сайте: ремонт ipad mini 4 цены
Наши мастера оперативно устранят неисправности вашего устройства в сервисе или с выездом на дом!
Предлагаем услуги профессиональных инженеров офицальной мастерской.
Еслли вы искали ремонт ipad pro 12.9 сервис, можете посмотреть на сайте: ремонт ipad pro 12.9 рядом
Наши мастера оперативно устранят неисправности вашего устройства в сервисе или с выездом на дом!
mexico drug stores pharmacies https://mexicaneasypharm.shop/# Mexican Easy Pharm
buying prescription drugs in mexico
mexican drugstore online https://mexicaneasypharm.shop/# Mexican Easy Pharm
mexican mail order pharmacies
canadian pharmacy ltd: pharmacy wholesalers canada – canadianpharmacyworld
reputable mexican pharmacies online: pharmacies in mexico that ship to usa – mexican mail order pharmacies
IndianCertPharm: п»їlegitimate online pharmacies india – Best Indian pharmacy
Indian Cert Pharm [url=https://indiancertpharm.com/#]Indian Cert Pharm[/url] Indian Cert Pharm
I plan on starting a blog and would eventually like to bring in ad revenue, should I start out on a free website or should I buy a domain?.
Mexican Easy Pharm [url=https://mexicaneasypharm.shop/#]mexico drug stores pharmacies[/url] Mexican Easy Pharm
mexico drug stores pharmacies https://mexicaneasypharm.com/# Mexican Easy Pharm
buying prescription drugs in mexico online
medicine in mexico pharmacies https://mexicaneasypharm.shop/# Mexican Easy Pharm
best online pharmacies in mexico
Предлагаем услуги профессиональных инженеров офицальной мастерской.
Еслли вы искали ремонт iphone 12 рядом, можете посмотреть на сайте: срочный ремонт iphone 12
Наши мастера оперативно устранят неисправности вашего устройства в сервисе или с выездом на дом!
https://canadianmdpharm.shop/# canada online pharmacy
legal canadian pharmacy online
Mexican Easy Pharm: medication from mexico pharmacy – п»їbest mexican online pharmacies
https://mexicaneasypharm.com/# Mexican Easy Pharm
vipps approved canadian online pharmacy
Mexican Easy Pharm [url=https://mexicaneasypharm.com/#]Mexican Easy Pharm[/url] mexico drug stores pharmacies
https://cytpharm.shop/# order cytotec online
Kamagra tablets
buy cytotec in usa [url=https://cytpharm.com/#]Cyt Pharm[/url] buy cytotec pills
cheap kamagra: Kamagra 100mg – Kamagra Oral Jelly
buy dapoxetine online: dap pharm – priligy
buy Kamagra: Kama Pharm – Kamagra 100mg
Sema Pharm 24: semaglutide best price – generic rybelsus tabs
https://semapharm24.com/# rybelsus semaglutide tablets
Kamagra 100mg
Kama Pharm: Kama Pharm – Kama Pharm
semaglutide tablets for weight loss [url=https://semapharm24.com/#]Sema Pharm 24[/url] cheap semaglutide pills
Kamagra 100mg price: Kama Pharm – Kama Pharm
https://kamapharm.shop/# Kama Pharm
super kamagra
semaglutide tablets price: SemaPharm24 – generic rybelsus tabs
Sema Pharm 24 [url=https://semapharm24.shop/#]SemaPharm24[/url] semaglutide tablets
п»їkamagra: Kama Pharm – Kama Pharm
Предлагаем услуги профессиональных инженеров офицальной мастерской.
Еслли вы искали ремонт iphone 12 рядом, можете посмотреть на сайте: срочный ремонт iphone 12
Наши мастера оперативно устранят неисправности вашего устройства в сервисе или с выездом на дом!
https://dappharm.com/# dap pharm
buy kamagra online usa
Kamagra tablets: buy kamagra online usa – super kamagra
https://kamapharm.shop/# Kama Pharm
can i buy prednisone from canada without a script
generic rybelsus tabs: semaglutide tablets store – semaglutide tablets price
http://semapharm24.com/# generic rybelsus tabs
п»їkamagra
buy priligy: buy priligy – priligy
Pred Pharm: PredPharm – prednisone
buy semaglutide [url=https://semapharm24.shop/#]generic rybelsus tabs[/url] semaglutide best price
dapoxetine price: buy priligy – buy dapoxetine online
http://predpharm.com/# Pred Pharm
sildenafil oral jelly 100mg kamagra
buy prednisone 20mg [url=https://predpharm.shop/#]Pred Pharm[/url] Pred Pharm
purchase prednisone from india: PredPharm – Pred Pharm
https://kamapharm.com/# sildenafil oral jelly 100mg kamagra
buy Kamagra
http://predpharm.com/# PredPharm
over the counter prednisone cheap
buy rybelsus online: Sema Pharm 24 – cheap semaglutide pills
http://predpharm.com/# prednisone 10 mg coupon
prednisone tablet 100 mg
dap pharm: buy priligy – priligy
PredPharm: generic prednisone tablets – PredPharm
https://dappharm.shop/# buy priligy
sildenafil oral jelly 100mg kamagra
Priligy tablets [url=http://dappharm.com/#]buy dapoxetine online[/url] priligy
buy priligy: Priligy tablets – cheap priligy
https://dappharm.shop/# cheap priligy
Kamagra tablets
dap pharm: priligy – priligy
cheap priligy: DapPharm – DapPharm
http://semapharm24.com/# buy semaglutide
prednisone 2.5 tablet
https://predpharm.shop/# prednisone drug costs
prednisone for sale in canada
prednisone purchase canada: PredPharm – Pred Pharm
https://semapharm24.com/# cheap semaglutide pills
sildenafil oral jelly 100mg kamagra
priligy: dap pharm – dap pharm
https://kamapharm.com/# Kama Pharm
buy Kamagra
PredPharm: PredPharm – PredPharm
buy cytotec online: Cyt Pharm – Cyt Pharm
sildenafil oral jelly 100mg kamagra [url=https://kamapharm.shop/#]Kama Pharm[/url] Kama Pharm
buy rybelsus online: Sema Pharm 24 – SemaPharm24
http://kamapharm.com/# Kama Pharm
super kamagra
buy rybelsus online [url=https://semapharm24.shop/#]semaglutide tablets price[/url] Sema Pharm 24
how to buy prednisone online: Pred Pharm – prednisone purchase online
http://kamapharm.com/# buy Kamagra
sildenafil oral jelly 100mg kamagra
buy dapoxetine online: Priligy tablets – buy dapoxetine online
https://predpharm.shop/# 5mg prednisone
order prednisone 100g online without prescription
https://semapharm24.shop/# SemaPharm24
prednisone prescription online
https://dappharm.shop/# DapPharm
Kamagra Oral Jelly
https://predpharm.com/# Pred Pharm
Kamagra 100mg price
dapoxetine online [url=http://dappharm.com/#]buy priligy[/url] Priligy tablets
prednisone tabs 20 mg: Pred Pharm – prednisone tabs 20 mg
buy priligy: dapoxetine price – Priligy tablets
buy cytotec over the counter: Misoprostol 200 mg buy online – Cytotec 200mcg price
prednisone 5 mg cheapest [url=https://predpharm.com/#]PredPharm[/url] prednisone uk price
super kamagra: Kama Pharm – Kama Pharm
https://cytpharm.shop/# Cyt Pharm
Kamagra Oral Jelly
https://dappharm.com/# priligy
how can i get prednisone online without a prescription
http://predpharm.com/# cost of prednisone 5mg tablets
can you buy prednisone online uk
buy prednisone without a prescription best price: buy prednisone 1 mg mexico – PredPharm
cytotec buy online usa: Cyt Pharm – buy cytotec online
cheap kamagra: Kamagra tablets – Kamagra tablets
CytPharm [url=https://cytpharm.shop/#]Cyt Pharm[/url] buy cytotec online
CytPharm: buy cytotec online – buy cytotec online
Ищете свадебного фотографа для идеальной свадебной фотосессии?
Я помогу запечатлеть самые трогательные моменты вашего дня! Эмоции, искренность и индивидуальность в каждом кадре.
заказать услугу и узнать подробнее – видеограф в коломне.
Ваша история любви — в моих фотографиях!
https://semapharm24.com/# semaglutide tablets
super kamagra
buy cytotec over the counter [url=https://cytpharm.com/#]buy cytotec pills online cheap[/url] CytPharm
http://semapharm24.com/# rybelsus semaglutide tablets
super kamagra
PredPharm: prednisone without prescription 10mg – Pred Pharm
Priligy tablets: priligy – dapoxetine online
DapPharm: DapPharm – dap pharm
https://predpharm.com/# Pred Pharm
buy Kamagra
https://cytpharm.shop/# Cyt Pharm
buy prednisone online without a script
https://kamapharm.shop/# buy kamagra online usa
п»їkamagra
CytPharm: cytotec buy online usa – Abortion pills online
buy dapoxetine online: buy priligy – dapoxetine price
prednisone 50 mg tablet cost: PredPharm – buy prednisone online without a prescription
PredPharm [url=https://predpharm.shop/#]Pred Pharm[/url] PredPharm
priligy: Priligy tablets – dap pharm
https://predpharm.shop/# Pred Pharm
п»їkamagra
Ищете свадебного фотографа для идеальной свадебной фотосессии?
Я помогу запечатлеть самые трогательные моменты вашего дня! Эмоции, искренность и индивидуальность в каждом кадре.
заказать услугу и узнать подробнее – свадебный фотограф.
Ваша история любви — в моих фотографиях!
https://kamapharm.shop/# Kama Pharm
cheap kamagra
buy cytotec online [url=https://cytpharm.com/#]order cytotec online[/url] CytPharm
Kamagra 100mg: Kama Pharm – Kamagra tablets
buy priligy: dapoxetine online – dapoxetine online
http://kamapharm.com/# buy Kamagra
prednisone pack
https://predpharm.shop/# prednisone pharmacy
prednisone 10mg for sale
semaglutide tablets store: generic rybelsus tabs – Sema Pharm 24
cytotec pills buy online: buy misoprostol over the counter – buy cytotec online
https://kamapharm.com/# Kama Pharm
sildenafil oral jelly 100mg kamagra
http://kamapharm.com/# Kama Pharm
Kamagra 100mg price
buy kamagra online usa: Kama Pharm – sildenafil oral jelly 100mg kamagra
Pred Pharm: Pred Pharm – PredPharm
semaglutide tablets for weight loss [url=http://semapharm24.com/#]semaglutide tablets for weight loss[/url] semaglutide tablets for weight loss
buy prednisone online uk: PredPharm – Pred Pharm
Cyt Pharm [url=https://cytpharm.com/#]buy cytotec online[/url] buy cytotec in usa
https://predpharm.com/# buying prednisone mexico
cheap kamagra
https://kamapharm.com/# Kamagra 100mg
prednisone 30 mg coupon
https://semapharm24.shop/# semaglutide tablets store
medicine prednisone 5mg
buy cytotec online: buy cytotec in usa – CytPharm
buy cytotec online: buy cytotec pills online cheap – buy cytotec online fast delivery
sildenafil oral jelly 100mg kamagra: Kama Pharm – Kamagra 100mg price
cheap priligy: priligy – buy priligy
https://dappharm.com/# cheap priligy
sildenafil oral jelly 100mg kamagra
https://kamapharm.shop/# Kama Pharm
Kamagra Oral Jelly
rybelsus semaglutide tablets: buy rybelsus online – SemaPharm24
prednisone 4mg tab [url=http://predpharm.com/#]prednisone canada pharmacy[/url] prednisone 10mg online
Kama Pharm: Kama Pharm – Kama Pharm
Sema Pharm 24: cheap semaglutide pills – SemaPharm24
Предлагаем услуги профессиональных инженеров офицальной мастерской.
Еслли вы искали ремонт imac 27 рядом, можете посмотреть на сайте: ремонт imac 27 в москве
Наши мастера оперативно устранят неисправности вашего устройства в сервисе или с выездом на дом!
https://kamapharm.com/# Kama Pharm
order prednisone online no prescription
https://dappharm.shop/# dapoxetine price
generic prednisone online
http://semapharm24.com/# SemaPharm24
buy kamagra online usa
Kama Pharm [url=https://kamapharm.shop/#]Kama Pharm[/url] sildenafil oral jelly 100mg kamagra
Pred Pharm: Pred Pharm – where can i buy prednisone without a prescription
https://semapharm24.com/# cheap semaglutide pills
п»їkamagra
Предлагаем услуги профессиональных инженеров офицальной мастерской.
Еслли вы искали ремонт ipad air 2, можете посмотреть на сайте: ремонт ipad air 2 в москве
Наши мастера оперативно устранят неисправности вашего устройства в сервисе или с выездом на дом!
semaglutide tablets: Sema Pharm 24 – cheap semaglutide pills
Kama Pharm: Kama Pharm – Kama Pharm
Предлагаем услуги профессиональных инженеров офицальной мастерской.
Еслли вы искали срочный ремонт imac 21, можете посмотреть на сайте: ремонт imac 21 сервис
Наши мастера оперативно устранят неисправности вашего устройства в сервисе или с выездом на дом!
Cyt Pharm: Cyt Pharm – buy cytotec over the counter
buy prednisone tablets online: prednisone 2.5 tablet – Pred Pharm
Kamagra 100mg price [url=https://kamapharm.com/#]Kamagra 100mg price[/url] Kama Pharm
https://kamapharm.shop/# cheap kamagra
prednisone buy canada
https://dappharm.com/# buy priligy
prednisone 60 mg
dapoxetine online: buy dapoxetine online – Priligy tablets
dapoxetine price: buy dapoxetine online – buy priligy
https://kamapharm.shop/# Kama Pharm
super kamagra
Pred Pharm: Pred Pharm – prednisone 12 mg
buy cytotec online [url=https://cytpharm.com/#]purchase cytotec[/url] buy cytotec pills online cheap
cheap semaglutide pills: buy semaglutide – semaglutide tablets
http://cytpharm.com/# buy cytotec pills
Kamagra 100mg
DapPharm: buy priligy – dapoxetine online
buy cytotec online: Cyt Pharm – buy cytotec online
Kama Pharm: cheap kamagra – Kama Pharm
Pred Pharm: Pred Pharm – PredPharm
http://dappharm.com/# Priligy tablets
50 mg prednisone from canada
https://predpharm.com/# PredPharm
prednisone otc price
Предлагаем услуги профессиональных инженеров офицальной мастерской.
Еслли вы искали ремонт ipad air 2, можете посмотреть на сайте: ремонт ipad air 2 сервис
Наши мастера оперативно устранят неисправности вашего устройства в сервисе или с выездом на дом!
https://dappharm.com/# buy dapoxetine online
Kamagra tablets
cytotec buy online usa: buy cytotec online – buy cytotec over the counter
Kamagra tablets [url=http://kamapharm.com/#]Kamagra 100mg price[/url] Kamagra 100mg price
Предлагаем услуги профессиональных инженеров офицальной мастерской.
Еслли вы искали ремонт imac 21, можете посмотреть на сайте: ремонт imac 21
Наши мастера оперативно устранят неисправности вашего устройства в сервисе или с выездом на дом!
semaglutide best price: Sema Pharm 24 – Sema Pharm 24
sildenafil oral jelly 100mg kamagra: Kamagra 100mg price – Kama Pharm
https://cytpharm.com/# buy cytotec online
buy Kamagra
buy cytotec online: Cyt Pharm – buy cytotec
buy priligy [url=http://dappharm.com/#]buy dapoxetine online[/url] buy priligy
sildenafil oral jelly 100mg kamagra: Kama Pharm – Kamagra Oral Jelly
https://dappharm.com/# buy dapoxetine online
prednisone 5mg daily
Kama Pharm: Kama Pharm – Kama Pharm
cheap priligy: dap pharm – dap pharm
buy rybelsus online: semaglutide tablets – rybelsus semaglutide tablets
https://kamapharm.shop/# Kama Pharm
super kamagra
Kama Pharm: Kama Pharm – Kamagra tablets
DapPharm: buy priligy – dapoxetine price
http://kamapharm.com/# Kamagra 100mg price
Kamagra 100mg
dapoxetine price [url=http://dappharm.com/#]Priligy tablets[/url] DapPharm
buy prednisone online fast shipping: compare prednisone prices – prednisone 80 mg daily
cheap kamagra: Kamagra Oral Jelly – Kama Pharm
https://cytpharm.com/# Cyt Pharm
prednisone tablets
Kama Pharm: Kama Pharm – Kama Pharm
buy priligy [url=https://dappharm.shop/#]Priligy tablets[/url] buy dapoxetine online
https://farmasilditaly.shop/# viagra naturale in farmacia senza ricetta
acquistare farmaci senza ricetta
viagra cosa serve: Farma Sild Italy – viagra consegna in 24 ore pagamento alla consegna
comprare farmaci online all’estero
https://farmaprodotti.shop/# farmacia online piГ№ conveniente
migliori farmacie online 2024
viagra cosa serve: Farma Sild Italy – viagra originale in 24 ore contrassegno
farmacia online piГ№ conveniente: farmacia online senza ricetta – farmacia online
acquistare farmaci senza ricetta
farmacie online affidabili: Farma Prodotti – farmacie online affidabili
https://farmaprodotti.shop/# comprare farmaci online con ricetta
acquisto farmaci con ricetta
https://farmaprodotti.com/# farmacia online senza ricetta
top farmacia online
http://farmasilditaly.com/# viagra generico recensioni
farmacia online senza ricetta
Farmacia online piГ№ conveniente [url=https://farmatadalitaly.com/#]Cialis generico[/url] farmacia online
Farmacie on line spedizione gratuita: п»їFarmacia online migliore – farmacie online affidabili
acquistare farmaci senza ricetta
http://farmasilditaly.com/# viagra acquisto in contrassegno in italia
farmacie online sicure
farmacie online sicure: Brufen senza ricetta – farmacie online sicure
farmacie online sicure: Farma Prodotti – comprare farmaci online con ricetta
acquisto farmaci con ricetta
siti sicuri per comprare viagra online [url=https://farmasilditaly.shop/#]viagra generico[/url] miglior sito dove acquistare viagra
https://farmasilditaly.shop/# viagra online spedizione gratuita
comprare farmaci online con ricetta
viagra naturale in farmacia senza ricetta: Farma Sild Italy – miglior sito dove acquistare viagra
Farmacia online miglior prezzo
https://farmasilditaly.shop/# alternativa al viagra senza ricetta in farmacia
Farmacia online piГ№ conveniente
https://farmasilditaly.shop/# siti sicuri per comprare viagra online
Farmacia online piГ№ conveniente
https://farmaprodotti.shop/# farmacia online
farmacia online senza ricetta
Farmacia online piГ№ conveniente: BRUFEN 600 acquisto online – acquisto farmaci con ricetta
Предлагаем услуги профессиональных инженеров офицальной мастерской.
Еслли вы искали ремонт фотоаппаратов canon сервис, можете посмотреть на сайте: ремонт фотоаппаратов canon в москве
Наши мастера оперативно устранят неисправности вашего устройства в сервисе или с выездом на дом!
migliori farmacie online 2024: Cialis senza ricetta – Farmacia online piГ№ conveniente
Farmacie on line spedizione gratuita
farmacie online sicure [url=http://farmaprodotti.com/#]Farma Prodotti[/url] farmacia online piГ№ conveniente
http://farmasilditaly.com/# pillole per erezione immediata
acquistare farmaci senza ricetta
gel per erezione in farmacia: FarmaSildItaly – miglior sito per comprare viagra online
farmaci senza ricetta elenco
https://farmabrufen.com/# BRUFEN 600 acquisto online
Farmacia online miglior prezzo
comprare farmaci online con ricetta: Ibuprofene 600 prezzo senza ricetta – farmacie online autorizzate elenco
viagra online in 2 giorni: Viagra – viagra originale in 24 ore contrassegno
farmacia online
farmacia online senza ricetta: comprare farmaci online con ricetta – Farmacia online piГ№ conveniente
https://farmasilditaly.com/# miglior sito per comprare viagra online
farmaci senza ricetta elenco
https://farmasilditaly.shop/# viagra pfizer 25mg prezzo
top farmacia online
siti sicuri per comprare viagra online: Farma Sild Italy – cerco viagra a buon prezzo
farmacie online autorizzate elenco
https://farmasilditaly.com/# viagra generico prezzo piГ№ basso
farmacie online autorizzate elenco
https://farmasilditaly.shop/# viagra prezzo farmacia 2023
Farmacia online miglior prezzo
viagra generico in farmacia costo: alternativa al viagra senza ricetta in farmacia – alternativa al viagra senza ricetta in farmacia
viagra generico recensioni [url=http://farmasilditaly.com/#]viagra farmacia[/url] viagra generico in farmacia costo
migliori farmacie online 2024: Farma Brufen – farmacie online sicure
farmacia online piГ№ conveniente
Farmacie on line spedizione gratuita: Cialis generico prezzo – comprare farmaci online con ricetta
http://farmasilditaly.com/# cialis farmacia senza ricetta
comprare farmaci online con ricetta
Farmacie online sicure: Farma Prodotti – top farmacia online
comprare farmaci online con ricetta
https://farmaprodotti.com/# farmacia online
farmacia online
https://farmabrufen.com/# Brufen senza ricetta
migliori farmacie online 2024
Farmacia online miglior prezzo: Cialis senza ricetta – farmacie online autorizzate elenco
acquisto farmaci con ricetta: BRUFEN 600 acquisto online – Farmacia online piГ№ conveniente
Farmacie on line spedizione gratuita
comprare farmaci online all’estero: Ibuprofene 600 prezzo senza ricetta – farmacia online piГ№ conveniente
farmacie online autorizzate elenco: Farma Prodotti – farmacia online senza ricetta
acquisto farmaci con ricetta
farmacia online piГ№ conveniente [url=https://farmatadalitaly.com/#]Tadalafil generico migliore[/url] farmacia online
https://farmatadalitaly.shop/# farmaci senza ricetta elenco
migliori farmacie online 2024
http://farmabrufen.com/# Ibuprofene 600 prezzo senza ricetta
farmacie online autorizzate elenco
cialis farmacia senza ricetta: viagra 100 mg prezzo in farmacia – gel per erezione in farmacia
viagra ordine telefonico: Farma Sild Italy – dove acquistare viagra in modo sicuro
acquistare farmaci senza ricetta
alternativa al viagra senza ricetta in farmacia [url=http://farmasilditaly.com/#]viagra senza prescrizione[/url] viagra originale in 24 ore contrassegno
comprare farmaci online all’estero: FarmaBrufen – Farmacia online piГ№ conveniente
acquistare farmaci senza ricetta: Farma Prodotti – farmacie online affidabili
п»їFarmacia online migliore
http://farmabrufen.com/# Brufen senza ricetta
farmacie online affidabili
http://farmatadalitaly.com/# migliori farmacie online 2024
farmacie online autorizzate elenco
Farmacia online miglior prezzo: BRUFEN prezzo – farmacie online affidabili
top farmacia online
farmacie online autorizzate elenco: Brufen senza ricetta – Farmacia online piГ№ conveniente
top farmacia online: Ibuprofene 600 prezzo senza ricetta – farmacie online sicure
Farmacie online sicure
Farmacia online miglior prezzo [url=https://farmabrufen.com/#]BRUFEN prezzo[/url] п»їFarmacia online migliore
https://farmasilditaly.shop/# farmacia senza ricetta recensioni
acquistare farmaci senza ricetta
https://farmatadalitaly.com/# farmacia online senza ricetta
acquistare farmaci senza ricetta
viagra generico sandoz: Farma Sild Italy – miglior sito per comprare viagra online
farmacia online piГ№ conveniente
acquisto farmaci con ricetta: Tadalafil generico migliore – migliori farmacie online 2024
farmacie online affidabili [url=https://farmatadalitaly.shop/#]Farm Tadal Italy[/url] п»їFarmacia online migliore
top farmacia online: Ibuprofene 600 prezzo senza ricetta – comprare farmaci online con ricetta
viagra originale in 24 ore contrassegno: FarmaSildItaly – viagra online in 2 giorni
farmacia online senza ricetta
https://farmatadalitaly.com/# п»їFarmacia online migliore
farmacia online senza ricetta
comprare farmaci online all’estero: Cialis generico prezzo – Farmacie online sicure
farmacie online autorizzate elenco
https://farmatadalitaly.shop/# farmacia online
Farmacie on line spedizione gratuita
Farmacie on line spedizione gratuita: FarmTadalItaly – migliori farmacie online 2024
farmacia online senza ricetta: Farma Prodotti – farmacia online
acquisto farmaci con ricetta [url=https://farmabrufen.shop/#]Brufen senza ricetta[/url] farmaci senza ricetta elenco
acquisto farmaci con ricetta: farmaci senza ricetta elenco – farmacia online
migliori farmacie online 2024
http://farmaprodotti.com/# acquistare farmaci senza ricetta
farmacia online
acquistare farmaci senza ricetta: Farma Prodotti – farmacia online
comprare farmaci online con ricetta
https://farmabrufen.shop/# BRUFEN 600 acquisto online
Farmacia online miglior prezzo
comprare farmaci online con ricetta [url=https://farmabrufen.com/#]Ibuprofene 600 prezzo senza ricetta[/url] farmacie online sicure
migliori farmacie online 2024: Farm Tadal Italy – farmacia online senza ricetta
farmacie online autorizzate elenco: Cialis generico prezzo – Farmacie online sicure
acquistare farmaci senza ricetta: Farma Prodotti – comprare farmaci online con ricetta
acquistare farmaci senza ricetta
https://farmabrufen.shop/# BRUFEN 600 acquisto online
acquisto farmaci con ricetta
farmacia online: Brufen senza ricetta – farmaci senza ricetta elenco
migliori farmacie online 2024